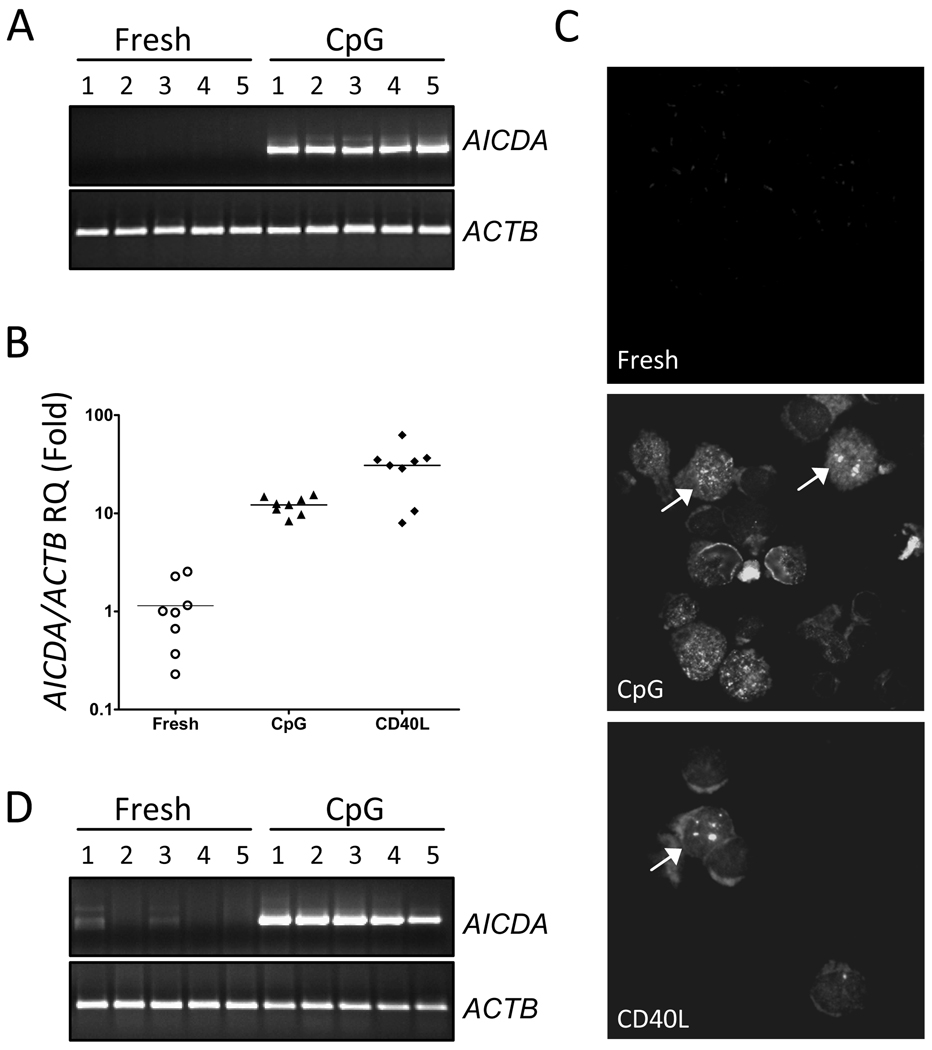
Figure 1. Analysis of CpG activated normal or malignant B-cells.
(A) Conventional PCR analysis of AICDA expression in freshly isolated or 3-day CpG stimulated normal B-cells. (B) Quantitative measurement of AICDA transcripts in 3-day CpG and CD40L stimulated normal B-cells. The final fold changes were calculated after normalization with the ACTB control gene, and unstimulated fresh normal B-cells as control samples. (C) Representative (n=3) immunofluorescence images of γ-H2AX staining for DNA damage foci as marked by yellow arrowheads. (D) Conventional PCR analysis of AICDA expression in freshly isolated or 3-day CpG stimulated CLL B-cells.

