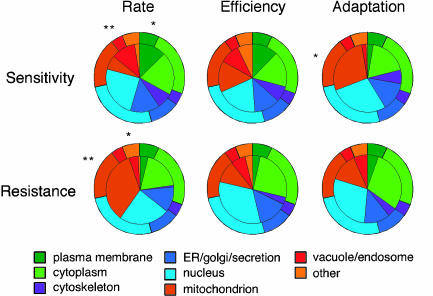
Fig. 4.
Subcellular localization of genes with significant (α < 0.001) salt-specific phenotypes. The outer pie chart indicates the subcellular distribution of all strains. The inner pie chart indicates the distribution of strains within the specified category (e.g., rate sensitivity). Subcellular distributions were taken from MIPS. *, Significant deviation in distribution (α < 0.025); **, highly significant deviation in distribution (α < 0.00125) from the complete set of strains.

