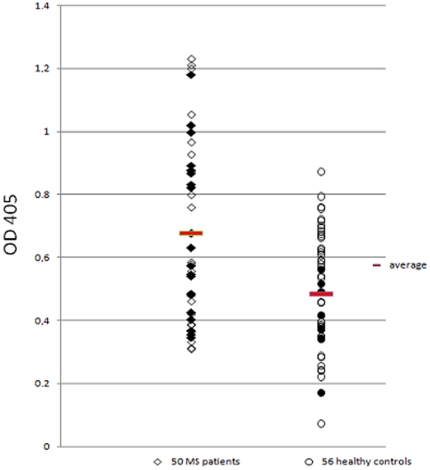
Figure 3. Evaluation of serum samples against MAP2694 recombinant protein.
MS patients sera are shown in the left column whereas Healthy Controls sera are shown in the right column. Data are presented as OD values observed in ELISA, as also described in the text. Data from a representative experiment out of three are shown. The mean value for each group is indicated by a thick horizontal line. IS900 PCR positive samples are indicated as black solid figures.

