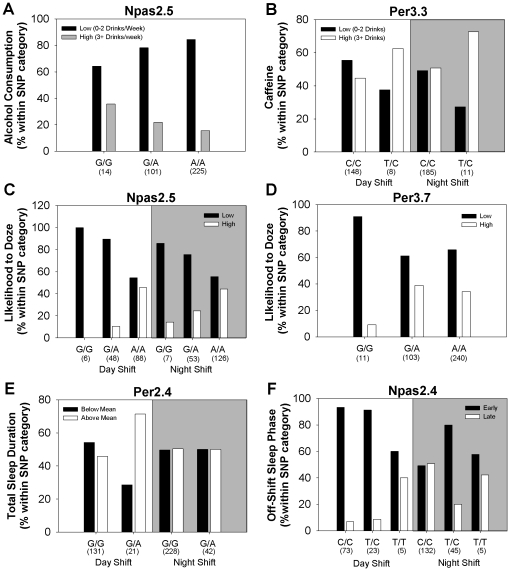
Figure 4. Circadian clock gene SNPs significantly associated with phenotypes.
(A–D) Significant single-locus associations with alcohol and caffeine consumption and likelihood to doze (p<0.009) were identified via regression analysis. The following contingency plots graphically depict these associations: (A) an intronic SNP (NPAS2.5) in NPAS2 predicted alcohol consumption independent of current shift type, R2 = 0.08, p<0.009. (B) A SNP in exon 17 (PER3.3) of PER3 predicted caffeine consumption for both day- and night-shifters (covariates: age and children at home, R2 = 0.15, p<0.009). (C) An intronic SNP (NPAS2.5) in NPAS2 predicted the likelihood to doze for both shift types, R2 = 0.08, p<0.009. “Low” refers to zero or slight chance of dozing and “High” refers to a moderate or high chance of dozing (see Question 10 in Figure S1); (D) the PER3.7 SNP predicted likelihood to doze independent of current shift type, R2 = 0.10, p<0.009. (E,F) Two gene SNPs were significantly associated with variables obtained from the typical schedule (p<0.009). (E) Using age and children at home as covariates, total duration of sleep for the work-cycle was significantly associated with PER2.4 (covariates: age and children at home, R2 = 0.09, p<0.009). Graph depicts the percentage of nurses within each genotype with sleep durations that fell above or below the mean for all nurses (67.3). This association was only significant for day-shift nurses. (F) Off-shift sleep phase (corrected for sleep debt as in [10]) was significantly associated with an NPAS2.4, R2 = 0.09, p<0.009. Graph depicts the percentage of day- and night-shift nurses (within each genotype) that had off-shift sleep phases that were early (lower 33%, with a mid-sleep time<3.0) or late (upper 33%, with a mid-sleep time>4.0). All panels: numbers in parentheses below each bar indicate the number of cases with that genotype.

