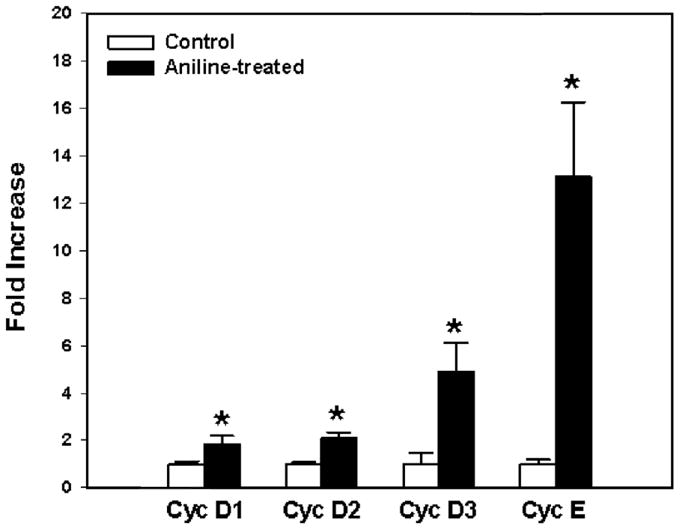
Fig. 5.

Real-time PCR analysis of cyclins D1, D2, D3 and E gene expression in the spleens of control and aniline-treated rats. Total RNA was extracted from spleens, real-time PCR was performed, and the fold changes in mRNA expression (2−ΔΔCT) were determined. Values are means ± SD ( n = 3). p < 0.05 vs. respective controls.
