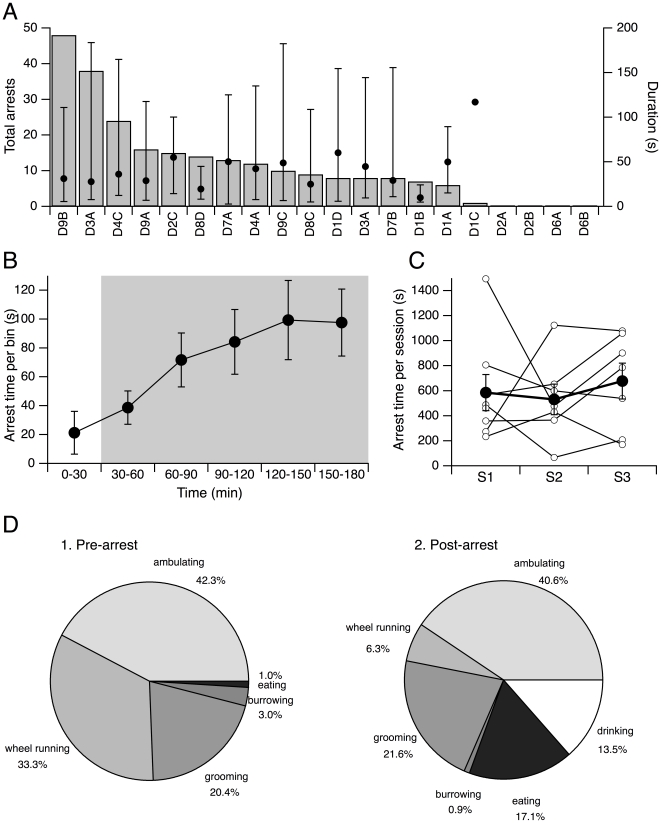
Figure 2. Behavioral arrests in DKO mice.
(A) Behavioral arrests in individual DKO mice. Left scale shows the total number of behavioral arrests in the three hour recording period by mouse (bars). Right scale shows the average duration of all recorded behavioral arrests (s; filled symbol) with the shortest and longest bouts indicated by the whiskers. (B) Mean (±SEM) total time per animal spent in behavioral arrest per 30 min bin shows that time spent in arrests increased substantially after the lights went out. (C) Total time per session for each mouse was variable (open symbols) but the mean (±SEM) time per mouse was stable across sessions (filled symbols). (D) Distribution of DKO behaviors prior to (1) and after (2) behavioral arrests.

