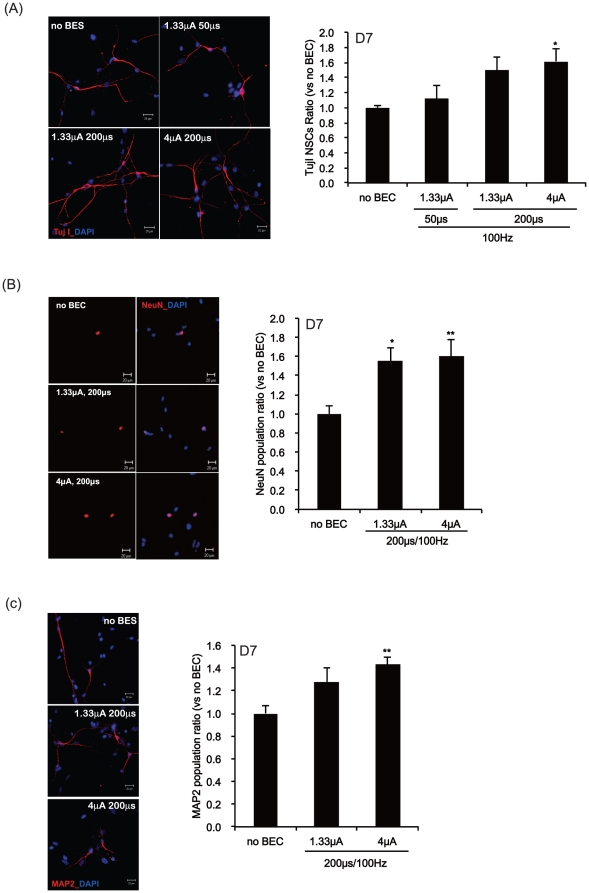
Figure 6. The effects of BEC on the neuronal populations during 7 days of differentiation.
At day 7 after exposure to electrical stimulation at 100 Hz with a magnitude of 1.33 or 4 µA/cm2 and duration of 50 or 200 µs, Tuj1, NeuN or MAP2 immunopositive neurons were counted for all differentiated cells. (A–C) Left panel: The differentiated NSCs were immunostained with anti-Tuj1 (A; red), NeuN (B; red) or MAP2 (C; red) and counterstained with DAPI (blue). Right panel: Counts of Tuj1 (A), NeuN (B) or MAP2 (C) immunopositive neurons. DAPI nuclear staining is for the total numbers of neurons. Data represent mean ± S.E.M. of n = 25–30. *, p≤0.05, **, p≤0.01 by One-Way ANOVA: Tukey's HSD Post Hoc test. Scale bar = 20 µm.

