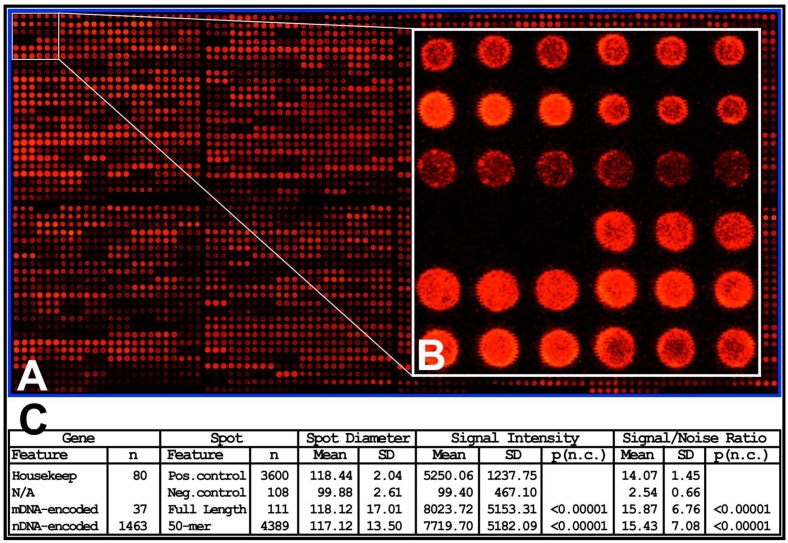
Fig 1.
High quality rMNChip microarray. (A) Representative microarray image of rMNChip. This pseudo-colored image represents an rMNChip microarray hybridized with the Cy5-labeled target cDNA reverse-transcribed from a rat brain RNA sample. Eight printing pinss were used to print 8 sub-arrays of rMNChip and each element was printed as a spot of technical triplicates adjacent to each other. The pixel intensities on spotted probes reflect abundances of hybridized target cDNA. (B) The inset shows details of spots morphologies of 12 genes (36 spots) with signal intensities ranging from high, to low and undetectable. (C) A table summarizes information of the genes and spots in the negative controls, positive controls, mtDNA- and nDNA-encoded test genes. The differences between the negative control and the others were highly significant (p<0.0001) while the difference between the positive control and the test spots were not statistically significant (p>0.05), as expected.

