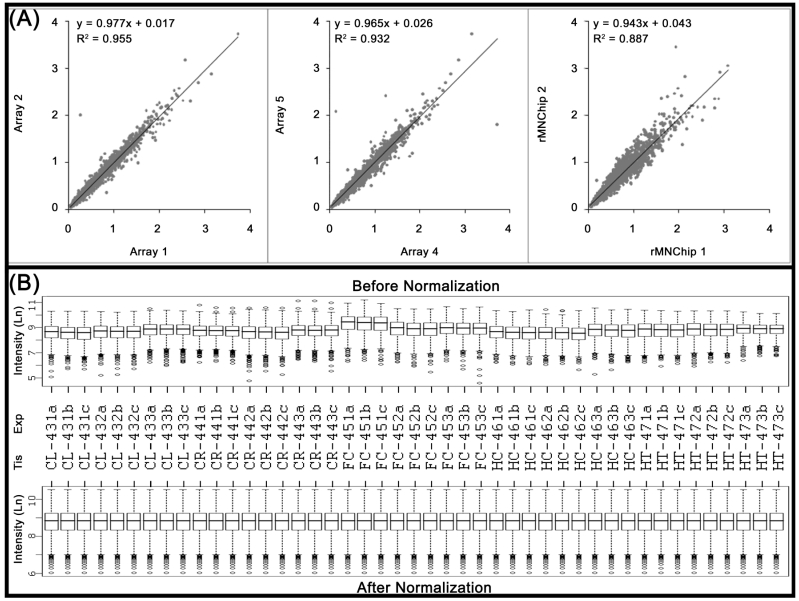
Fig 2.
Consistency of the rMNChip microarrays and data normalization. (A) The consistency in gene expression levels between the intra and inter rMNChip microarrays hybridized with the same RNA sample. A scatter plot and fitted line of signal intensities of 1,465 informative genes between two sets of genes on Array 1 and Array 2 on Slide 1 (left panel) and Array 4 and Array 5 on Slide 2 (middle panel), and between two different rMNChip microarrays (right panel). Each array was hybridized with Cy5-labeled cDNA sample synthesized from the same RNA samples via parallel microarray experiments. The normalized (but not log-transformed) signal intensities of 1,465 informative genes from one were plotted against those of the other. The strong linear relationship (y = ax + b) and the positive coefficient of determination (r2) were computed from the scatter plots and indicated in each comparison. “x”: signal intensity of a spot on one microarray, “y”: signal intensity of the corresponding spot on the other microarray. (B) Box plots of expression data before and after normalization. The quantile normalization algorithms were used to adjust the values of the background-subtracted mean pixel intensities of each and every set of 4,395 spots across intra- and inter- rMNChip microarrays hybridized with Cy5-labeled RNA samples indicated. In contrast to the boxplot of pre-normalization data (top panel), the post-normalized data distributes in the same intervals with the same density center, indicating successful adjustment of data. The post-normalized data were used for further analysis. Ln: the natural logarithm, Tis: brain tissue, Exp: microarray experiments including technical and experimental triplicates, CL: cerebellum, CR: cerebrum, FC: frontal cortex, HC: hippocampus, and HT: hypothalamus.

