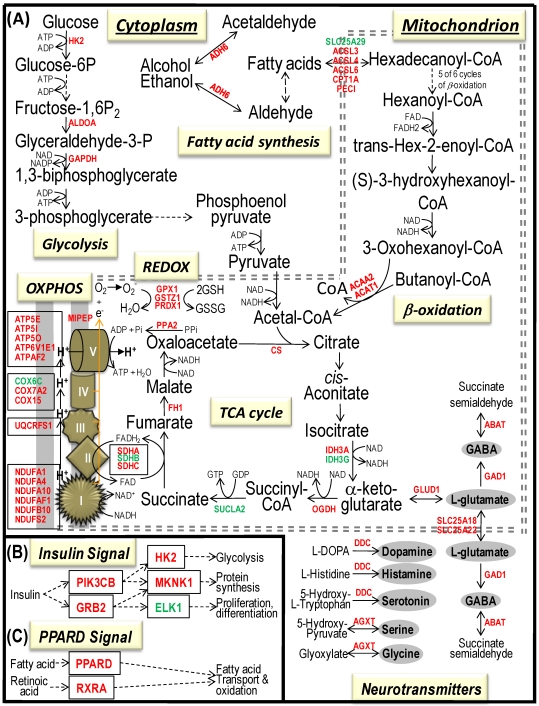
Fig 4.
Bioenergenesis neurotransmitter pathways with differentially expressed genes between frontal cortex and hippocampus. A solid line with arrowhead indicates a direct reaction or transport. A dashed line with arrowhead indicates more than one steps involved in passages. The RNA levels of genes in red or green colors were expressed significantly higher or lower in the frontal cortex than in hippocampus, respectively. If the changes in RNA levels were not significant (p>0.05) or less than 1.25-fold, the gene symbols or enzymes are not shown in the flow chat. The mean expression levels, standard deviations, fold changes, p-values, false discovery rate (FDR) and the full name of genes are listed in Table 2. (A) Bioenergenesis neurotransmitter pathways include glycolysis, fatty acid synthesis, and neurotransmitter synthesis in cytoplasm and β-oxidation, TCA cycle and OXPHOS, REDOX, and neurotransmitter synthesis in mitochondria. Double dashed lines represent the inner and outer mitochondrial membranes, of which a portion was enlarged to illustrate OXPHOS complexes I, II, III, IV and V with differentially expressed genes in each complex. A proton (H+) flow and ATP synthesis are indicated. REDOX enzymes (GPX1, GSTZ1 and PRDX1) are involved in removal of ROS (e.g. O2-). Mitochondrial and cytoplasmic enzymes with RNA levels higher in the frontal cortex than in hippocampus for synthesis of neurotransmitters (gray ovals) include Glud1 for synthesis of the most abundant excitatory neurotransmitter L-glutamate, GAD1 and ABAT for the most abundant inhibitory neurotransmitter γ-aminobutyric acid [GABA], DDC for dopamine, histamine and serotonin, and AGXT for serine and glycine. SLC25A18 and SLC25A22 are involved in transport of L-glutamate across mitochondrial membranes. (B) Insulin signaling pathway. Insulin binding to its receptor results in the tyrosine phosphorylation of insulin receptor substrates. This leads to activation of phosphoinositide-3-kinase (PIK3CB) and growth factor receptor-bound protein (GRB2). These in turn lead to upregulation of insulin-responsive genes including hexokinase 2 (HK2) and MAP kinase interacting serine/threonine kinase 1 (MKNK1). HK2 at the outer mitochondrial membrane phosphorylates glucose into glucose-6-phosphate, the first rate-limiting step of glycolysis pathway. MKNK1 in cytoplasm phosphorylates the eukaryotic translation initiation factor (EEIF4E) initiating protein synthesis, of which 18 of 25 genes displayed RNA levels higher in the frontal cortex than in hippocampus (Table 2). MKNK1 also modifies proteins posttranslationally. ELK1 member of ETS oncogene family (ELK1) plays a critical role in mitogen growth factor signal transduction, and its downregulation suggests decreased activities in proliferation and differentiation. (C) PPARD signaling pathway. Peroxisome proliferator-activated receptor delta (PPARD) is a nuclear hormone receptor and transcriptional regulator. Retinoid X receptor alpha (RXRA) is a steroid and thyroid hormone receptor and transcriptional regulator. Both PPARD and RXRA are involved in fatty acid transport and oxidation via binding to DNA and regulating transcription.

