Fig. 1.
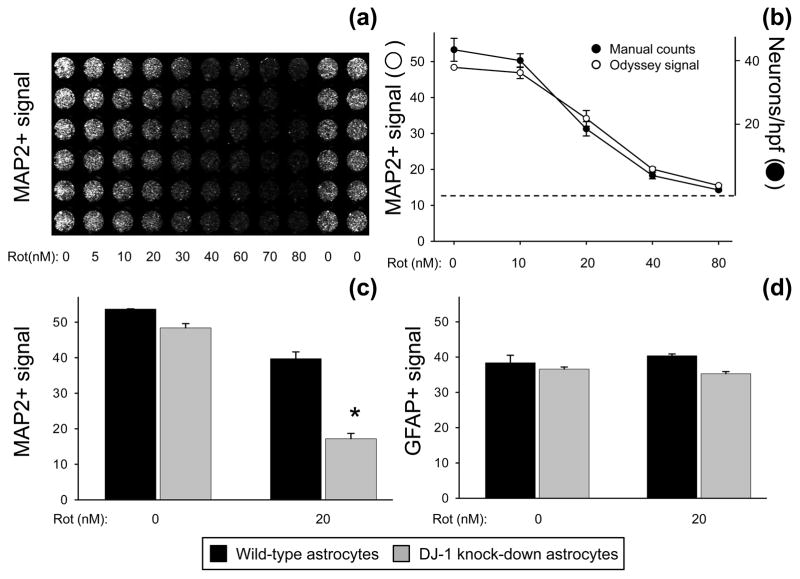
Neuronal survival bioassay. (a) Portion of sample 96-well plate showing neuron-astrocyte co-cultures with Odyssey infrared scanner-visualized MAP2+ (neuronal) signal over a rotenone dose-response curve from 0–80 nM. (b) MAP2+ signal from the bioassay (open circles, Odyssey-generated intensity units) plotted with MAP2+ manual count data from the same wells (filled circles, neurons per high-power field [hpf]). The dotted line represents the background level for Odyssey detection and the zero cell level for manual counts. Mean ± SE shown, n = 4. (c) Pre-treatment neurons survived and developed equally well when co-cultured on wild-type (siNS-transfected, black bars) or DJ-1 knock-down (siDJ#2-transfected, gray bars) astrocytes. Neurons co-cultured with wild-type astrocytes survived significantly better than those co-cultured with DJ-1 knock-down astrocytes after 72 h treatment with 20 nM rotenone. The asterisk (*) represents p < 0.05 vs. wild-type by paired t-test. Mean ± SE shown, n = 5. (d) Neither DJ-1 manipulation nor 72 h treatment with 20 nM rotenone affected Odyssey-detected GFAP+ signal (astrocyte viability) in the co-cultures. Mean ± SE shown, n=5.

