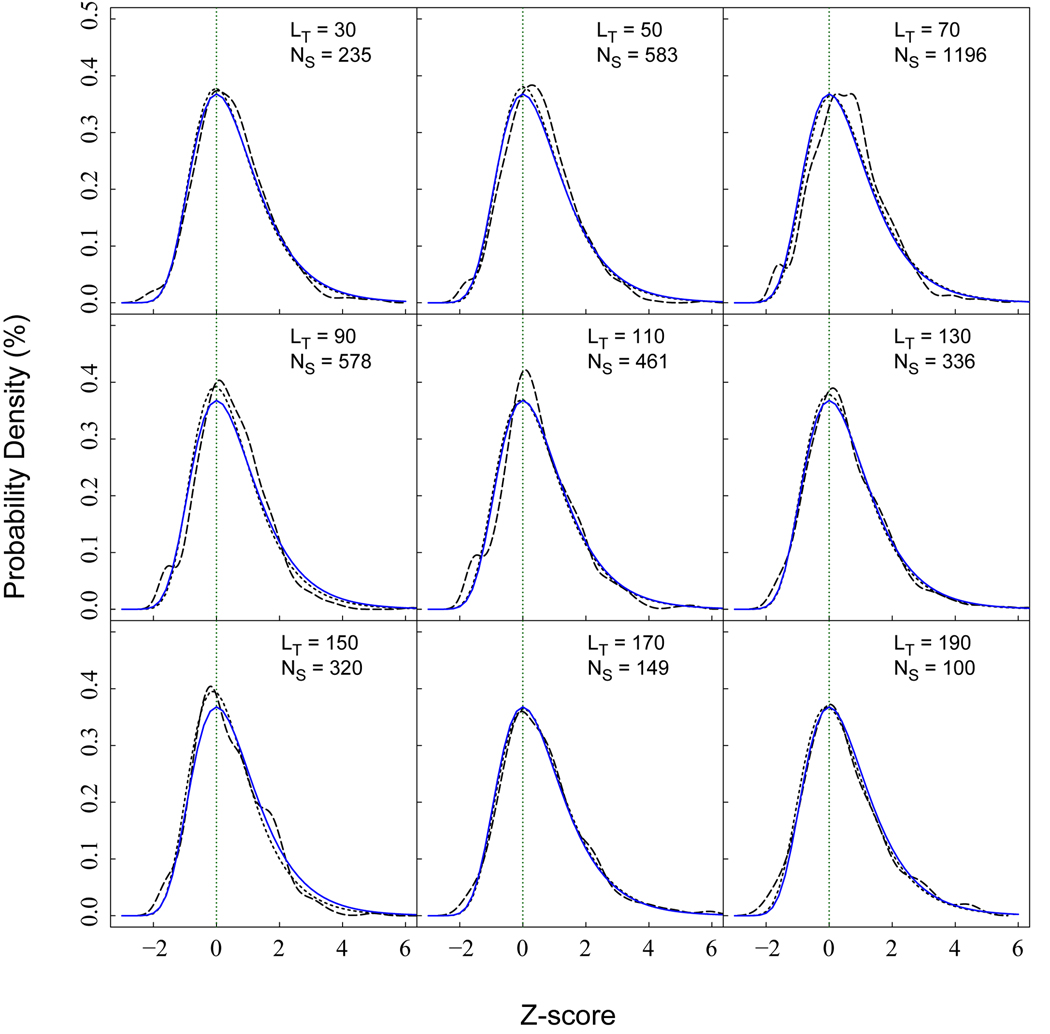
Fig. 2.
Distributions of the Z-score among random interfaces of various lengths. Long dashed lines are the observed probability density, and the short dashed lines are direct fits using the Gumbel distributions. Solid lines are probability densities calculated for the IS-scores with statistical models described by Eq. 4 and 6. LT represents the length of query, and NS is the number of samples.

