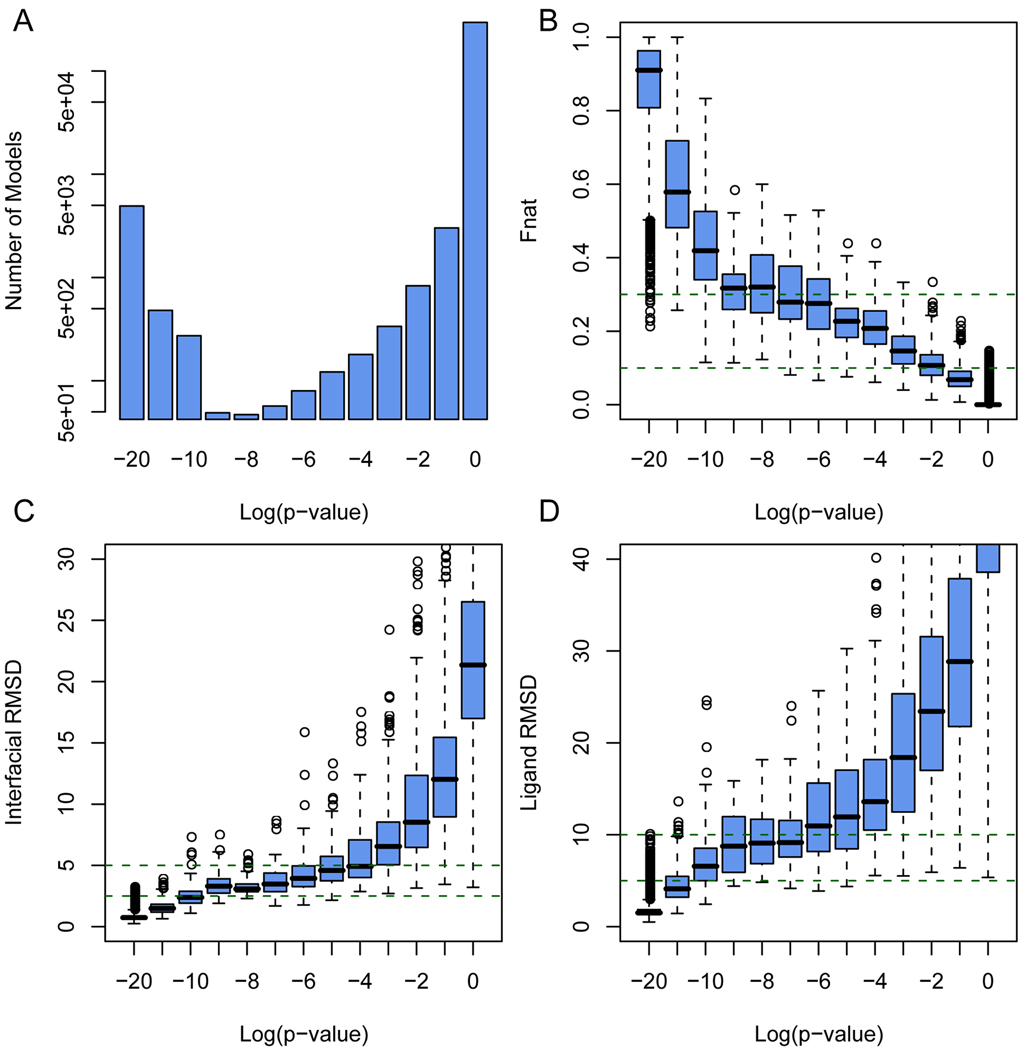
Fig. 4.
Quality assessments of 152,600 docking models generated for 1,526 protein complexes. (A) Number of docking models according to the IS-score P-values. Box plots of docking models according to (B) fraction of native contacts preserved in models, (C) interfacial and (D) ligand RMSDs. The lower, middle and upper quartiles of each box are the 25th, 50th, and 75th percentile; whiskers extend to a distance of up to 1.98 times the interquartile range. Outliers and means are represented by circles.

