Figure 5.
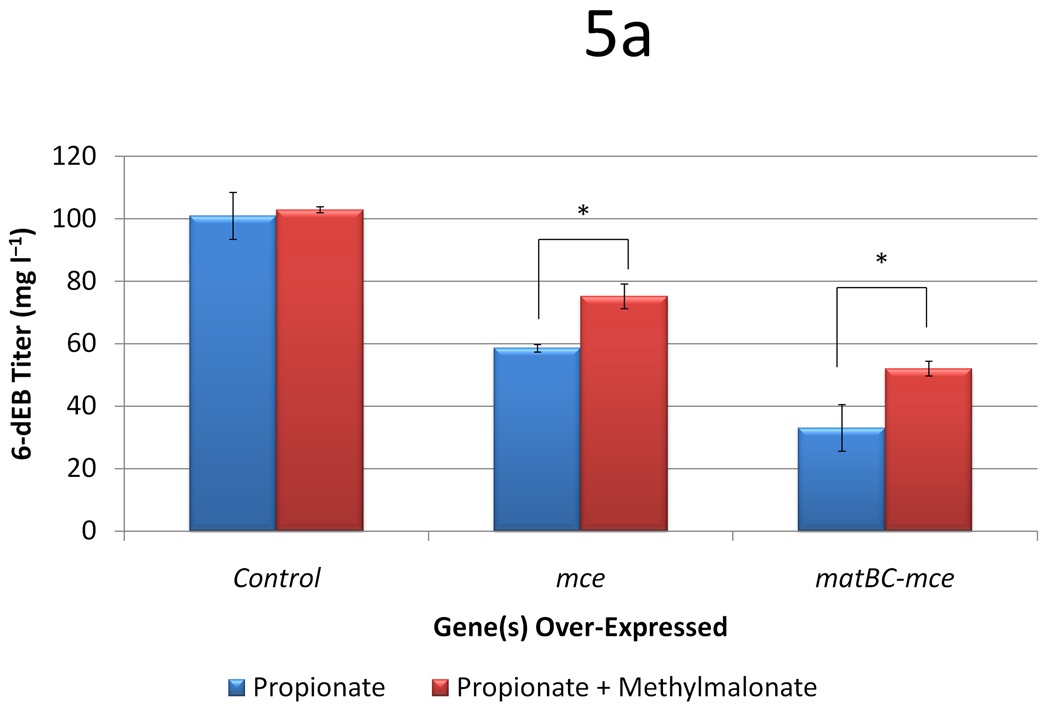
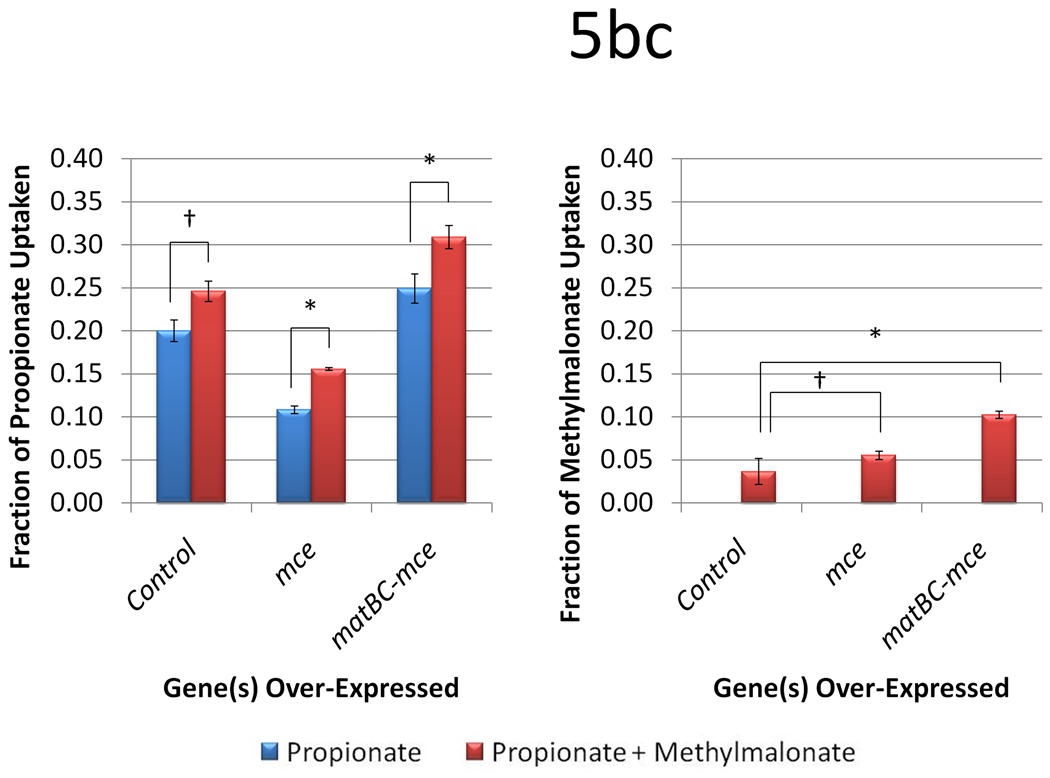
Data from engineering the methylmalonate pathway in the presence of propionate for TB3. Cultures were fed either 20 mM propionate or 20 mM propionate and 20 mM methylmalonate. Three different plasmid systems were analyzed (a control with only pBP130 and pBP144, an additional pCDFDuet-mce, and pACYCDuet-matBC/pCDFDuet-mce). Panel (a) shows the 6-dEB titer, (b) shows the fraction of propionate uptake, and (c) shows the fraction of methylmalonate uptake as a function of these parameters. Error bars represented ± one standard deviation from three replicates. * indicates statistically significant results (p < 0.05), while † indicates statistically insignificant results (p > 0.05) between the comparisons shown.


