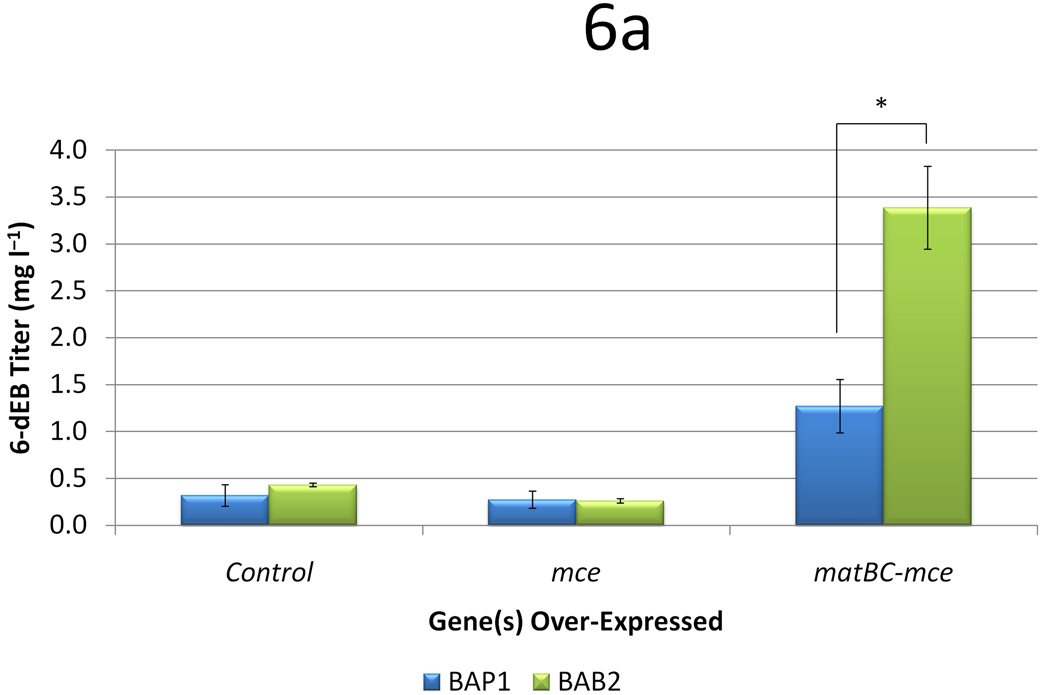
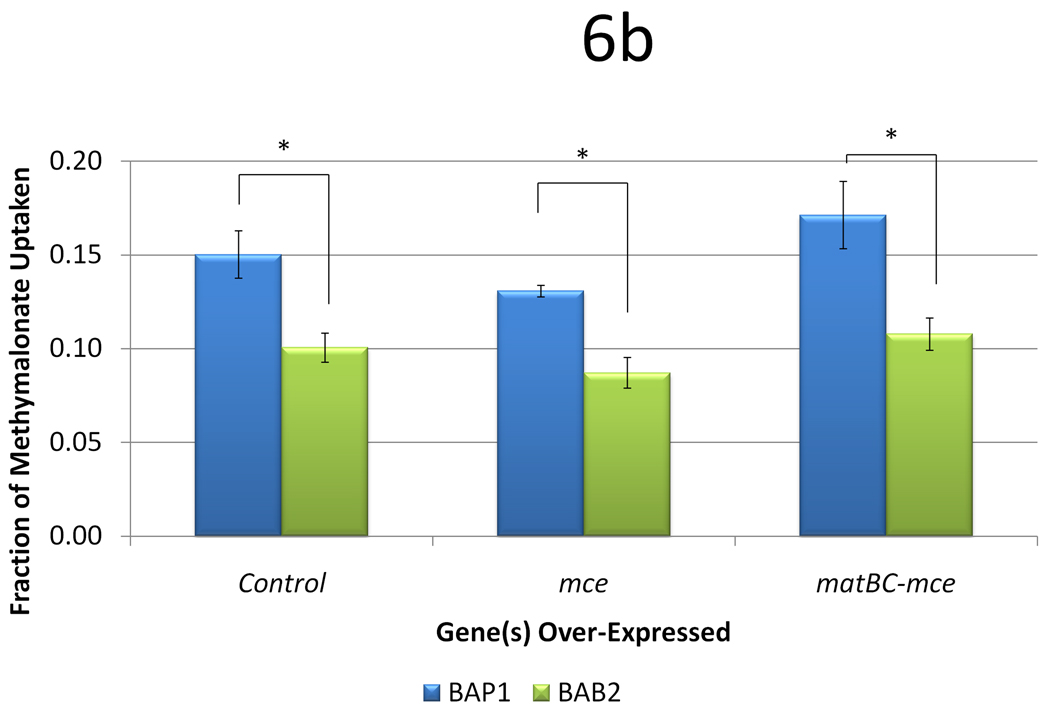
Figure 6.
Data from engineering the methylmalonate pathway in the absence of propionate, as a function of three strains (BAP1, TB3, and BAB2) and three plasmid systems (a control with only pBP130 and pBP144, an additional pCDFDuet-mce, and pACYCDuet-matBC/pCDFDuet-mce). Panel (a) shows the 6-dEB titer, while panel (b) shows the fraction of methylmalonate utilized as a function of these cellular parameters. Error bars represented ± one standard deviation from three replicates. * indicates statistically significant results (p < 0.05) between the comparisons shown.


