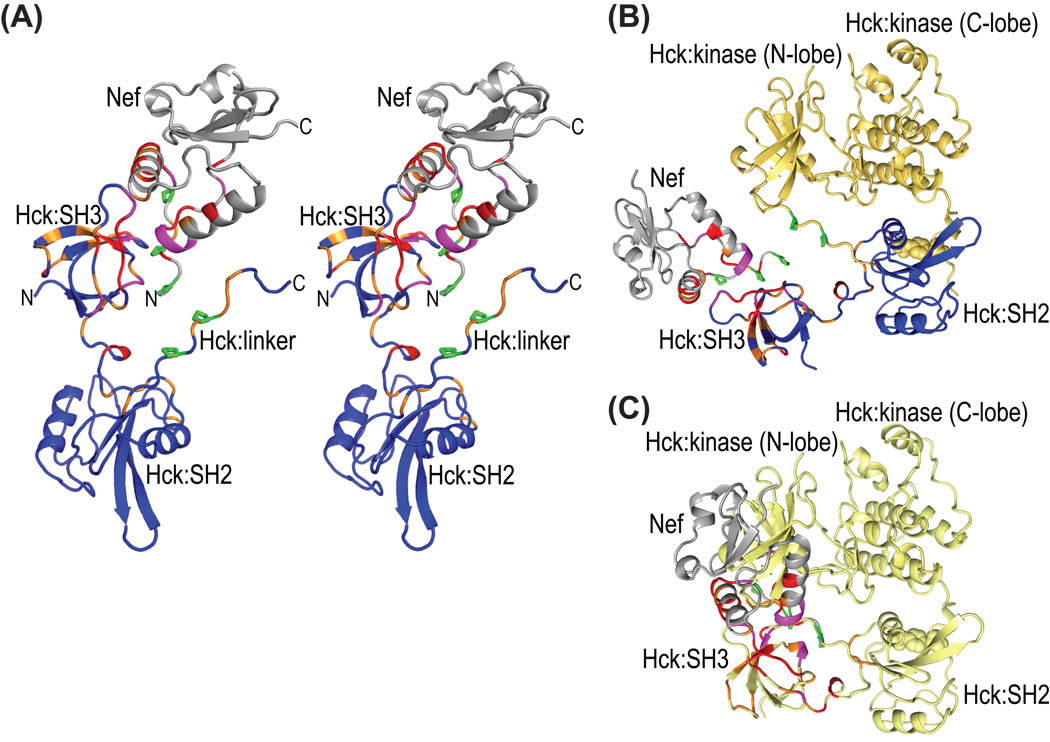
Figure 6.
Structural mapping of all chemical shift changes for complex formation between full-length Nef and Hck32L onto a ribbon representation of the Nef-Hck model. (A) Stereoview of the structural model of the Hck32L/Nef complex in ribbon representation, colored using the same code as in Figures 2B and 5B based on the NMR binding data. Hck32L is shown in blue and Nef in grey with residues exhibiting changes >0.12 ppm and between 0.06 and 0.12 ppm colored red and orange, respectively. Those residues whose resonances experience severe line-broadening are colored magenta. Side chains of Pro72, Pro75 and Pro78 in Nef and Pro246 and Pro249 in the linker of Hck32L are depicted in green stick representation. (B) Structural model (ribbon representation) of the full-length Hck-Nef complex generated by assuming that the same relative SH3-SH2 orientation as in our current NMR model is present in full-length Hck. The same color scheme as in (A) is used for Nef and the SH3-connector-SH2 portion of Hck. The backbone structure of the linker and kinase region is shown in yellow. (C) Illustration of the steric interference created if Nef (grey) is added to the 1AD5 full-length Hck structure (yellow ribbon). The chemical shift changes upon complex formation (data and color-coding as in A) are also colored for Nef and Hck32L.

