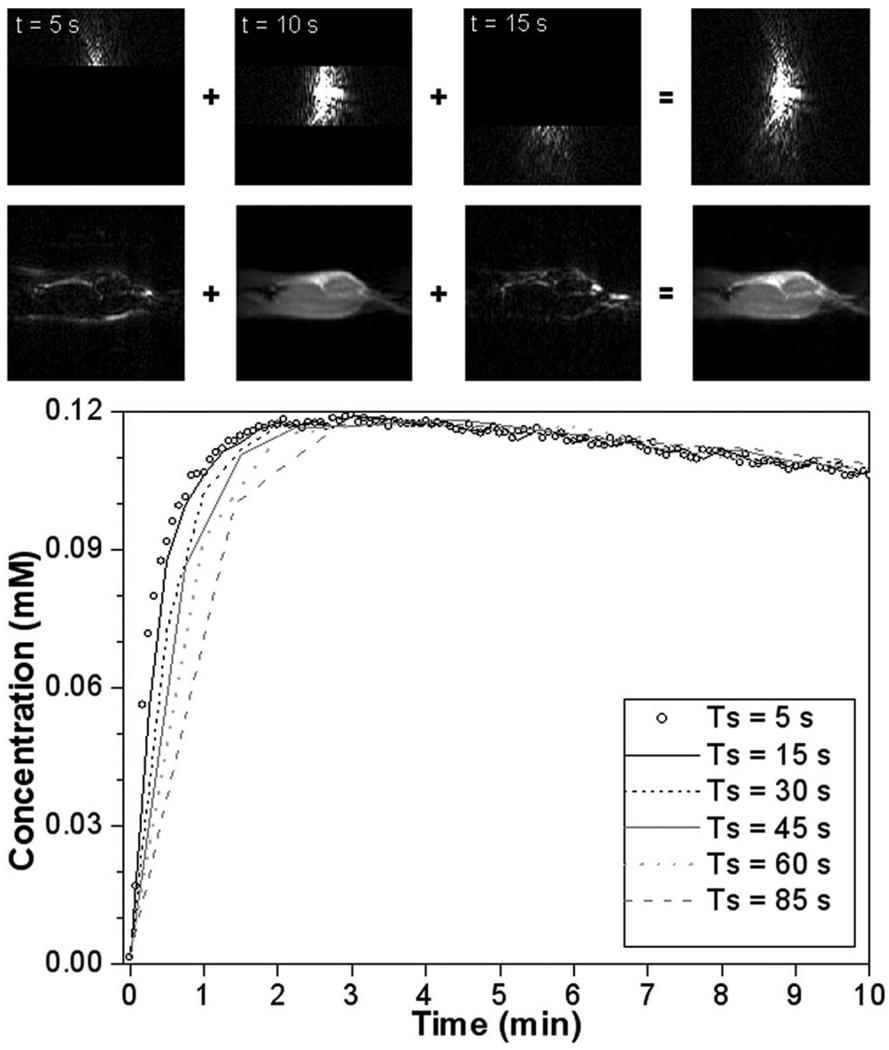
FIG. 2.
Illustration of the downsampling strategy (from Ts = 5 sec to Ts = 15 sec) mimicking a linear phase-encoding order, applied to case 1. First row of images: three consecutive parts of k-space data add up to a new set; second row: the corresponding images. Plot: the mean CA uptake in the viable tumor segmentation for case 1 at all temporal resolutions. Especially during the initial phase, the uptake curves do not overlap.

