Fig. 3.
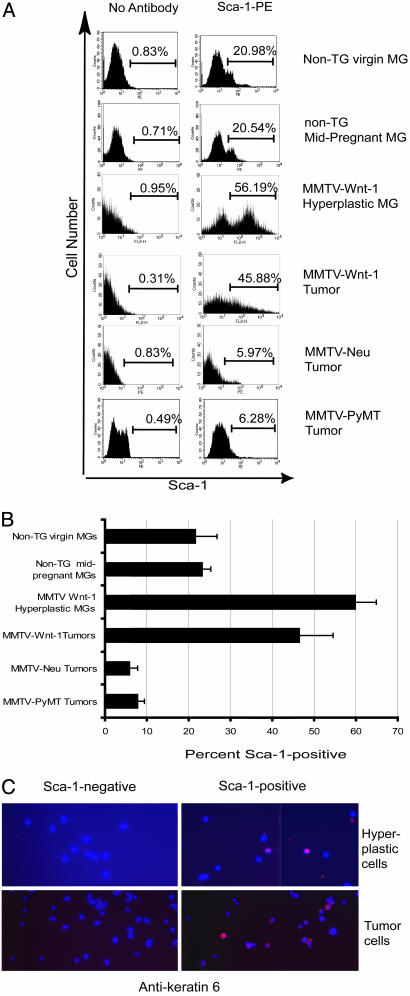
Increased proportions of Sca-1-positive cells in hyperplastic mammary glands and mammary tumors from MMTV-Wnt-1 TG mice. Representative FACS histograms (A) and a summary bar graph (B) representing data from three to five independent FACS experiments are shown for mammary glands from wild-type virgin and mid-pregnancy mice, hyperplastic mammary glands from MMTV-Wnt-1 TG mice, and mammary tumors from TG mice carrying MMTV-Wnt-1, MMTV-Neu, or MMTV-PyMT transgenes. Hyperplastic cells or tumor cells prepared from MMTV-Wnt-1 TG mice were stained with anti-Sca-1-FITC, sorted by FACS, and stained for keratin 6 (C). Red indicates positive staining for keratin 6. Images were captured by using a ×40 objective.

