Fig. 3.
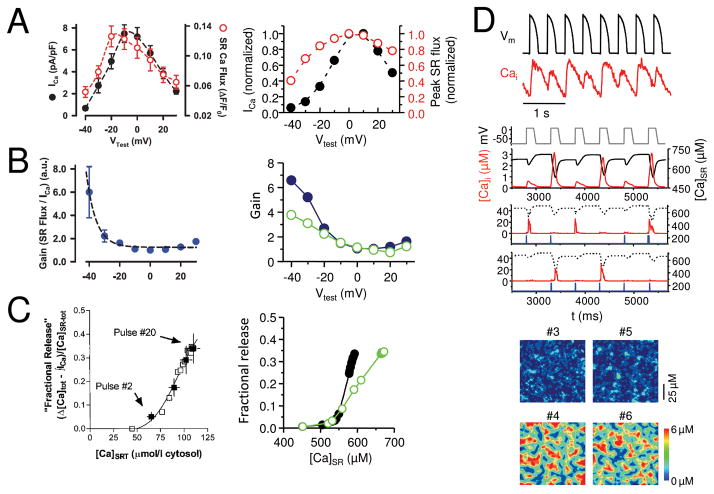
A. Graded Ca release. SR Ca release flux (black) tracks the amplitude of the L-type Ca current (red) during voltage clamps to different membrane voltages (Vm) in a rabbit ventricular myocyte 25, reproduced by the couplon network model(right). B. Voltage-dependent EC coupling gain. EC coupling gain, defined as the ratio of SR Ca release to the L-type Ca current amplitude, is higher at less depolarized voltages in experimental data from rabbit ventricular myocytes (left, from 25). The steep decline in gain is reproduced better in the couplon network model(right) when the couplons are coupled (solid symbols) than when uncoupled (open symbols). C. Steep SR fractional release-load relationship. The fraction of SR Ca released increases steeply as the SR load increases in a rabbit ventricular myocyte 23 (left). The steepness is more accurately reproduced by the couplon network model(right) when the couplons are coupled (solid symbols) than when uncoupled (open symbols). D. Ca alternans. During rapid pacing with a fixed AP wavefrom (black), the Ca transient (red) alternates between large and small on successive beats in a patch-clamped rabbit ventricular myocyte (top panel), reproduced by the couplon network model8(lower panels). 2nd panel shows alternans of the global Ca transient and SR Ca content during pacing with a fixed voltage waveform. 3rd and 4th panels show two representative couplons in the network, exhibiting irregular activations instead of alternans. 5th and 6th panels show the spatial patterns of Ca release from couplons during alternans on 4 successive beats. Note that when the two small beats or two large beats are compared to each other, the spatial patterns differ, indicating the macroscopic alternans is not accompanied by microscopic alternans.

