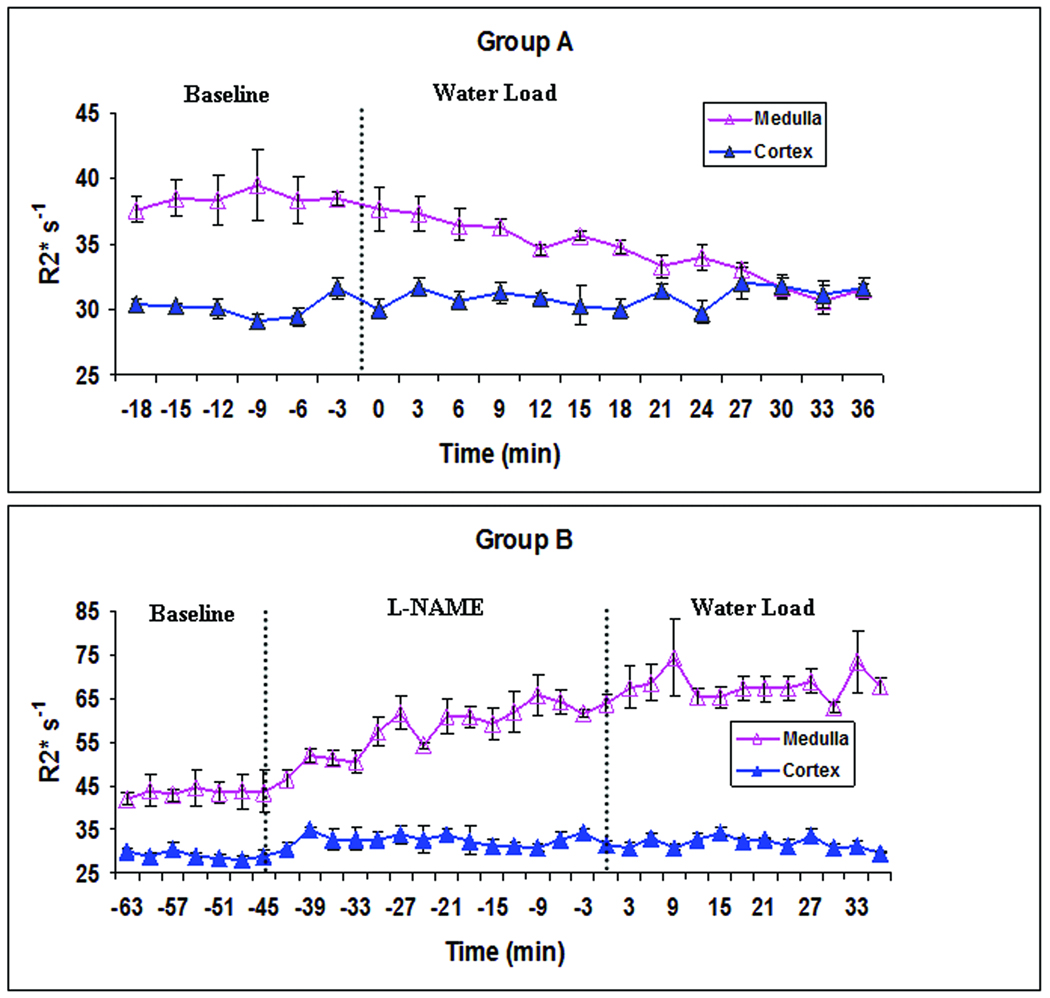
Figure 2.
Illustrates time course of cortical and medullary variation in R2* during water-loading in one representative animal in each of the groups A (top) and B (bottom). Note the significant decrease in medullary R2* values, approaching the cortical values in group A during water-loading. Note the absence of similar decrease in R2* in group B during water-loading. Also note the significant increase in R2* in group B prior to water-loading illustrating a decline in medullary oxygenation due to the administration of L_NAME. Time zero represents the start of water load in both groups of animals. The error bars show the standard error estimated over 3 ROIs in each, cortex and medulla.

