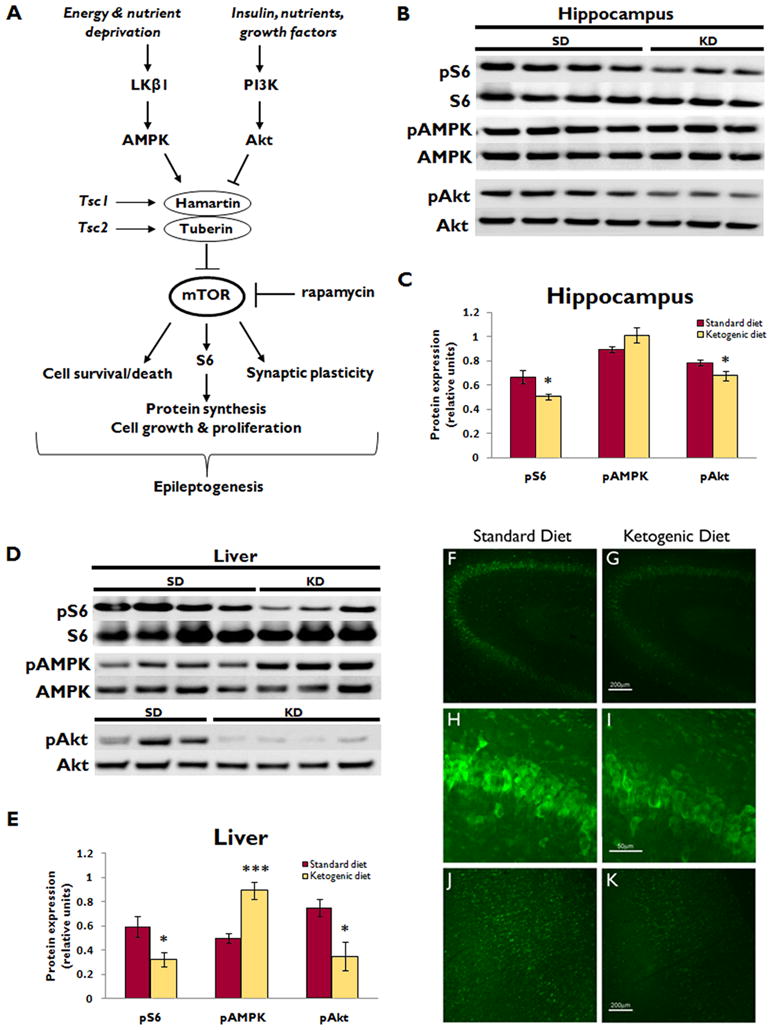
Figure 1. Ketogenic diet inhibits mTOR signaling in hippocampus and liver of normal rats .

(A) Simplified schematic diagram of mTOR pathway signaling. mTOR integrates numerous upstream signals to control cellular functions that may be involved in epileptogenesis, including cell growth, proliferation, survival versus death, and synaptic plasticity. mTOR is regulated by the hamartin/tuberin complex. Insulin and other growth factors activate PI3K/Akt signaling, which inhibits the hamartin/tuberin complex, thereby relieving the inhibition of mTOR and allowing for mTOR-mediated anabolic processes. Conversely, in the setting of nutrient or energy deprivation, the AMPK pathway is activated, which augments the hamartin/tuberin inhibition of mTOR to shut off energy-requiring processes when resources are scarce. Rapamycin is the prototypic mTOR inhibitor. AMPK, AMP-activated protein kinase; PI3K, class I phosphoinositide-3 kinase; S6, ribosomal protein S6; Tsc1 and Tsc2, tuberous sclerosis complex genes 1 and 2.
(B) Western blotting shows pS6 and total S6 expression, as well as upstream pAMPK, total AMPK, pAkt, and total Akt expression in the hippocampus of normal rats after administration of either ketogenic diet (KD) or standard diet (SD) for two weeks. Each lane represents protein isolated from a single animal.
(C) Quantitative plot showing ratio of phosphorylated to total protein expression demonstrates that KD reduced hippocampal pS6 and pAkt expression (*p<0.05 for both), but did not affect pAMPK expression. (n=7 for each group)
(D) Western blotting of liver illustrates pS6 and total S6 expression, as well as upstream pAMPK, total AMPK, pAkt, and total Akt expression in normal rats after administration of KD or SD for two weeks. Each lane represents protein isolated from a single animal. Blots shown are examples from two sets of experiments, one with n=3 and one with n=4 KD fed rats, for a total of n=7 for each group.
(E) Quantitative plot showing ratio of phosphorylated to total protein expression demonstrates that KD reduced liver pS6 and pAkt expression (*p<0.05 for both), and increased pAMPK expression (***p<0.001). (n=7 for each group)
(F, G) Low power images of pS6 stained coronal sections through CA3 of the hippocampus, illustrating the reduction in pS6 expression in KD (G) compared to SD (F). Scale bar = 200μm.
(H, I) High power images of the same sections demonstrate the reduction in pS6 expression in CA3 pyramidal neurons of KD-fed rats (I) compared to SD (H). Scale bar = 50μm.
(J, K) Low power images of pS6 stained coronal sections through neocortex demonstrate a reduction in pS6 expression in KD-fed rats (K) compared to SD (J). Scale bar = 200μm.
