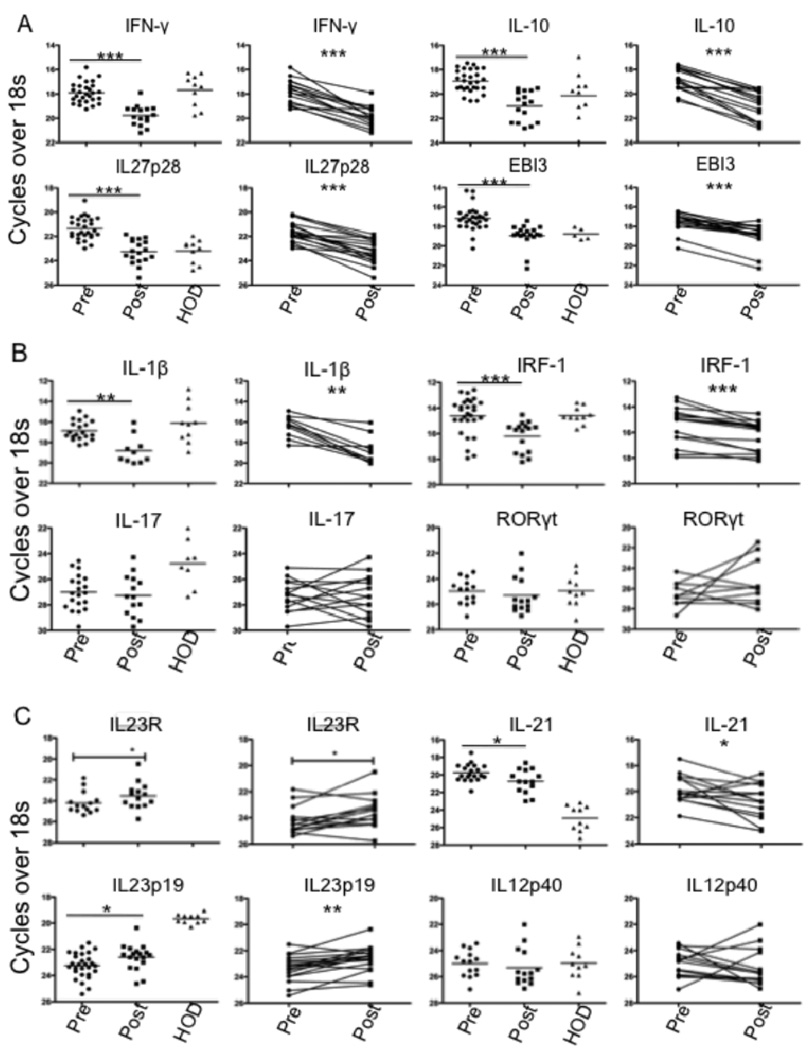
FIGURE 2.
Cytokine mRNA expression in VL spleen. (A–C) Ex-vivo analysis of relative mRNA levels for indicated genes in splenic aspirates from VL patients before (n = 28) or 21–30 d after treatment (n = 18) and in HOD spleen samples (n = 10). Paired pre- and post- treatment samples(n = 18) are also shown separately. Significant differences are indicated with *, p < 0.05; **, p < 0.01; ***, p < 0.001.

