
Figure 4.
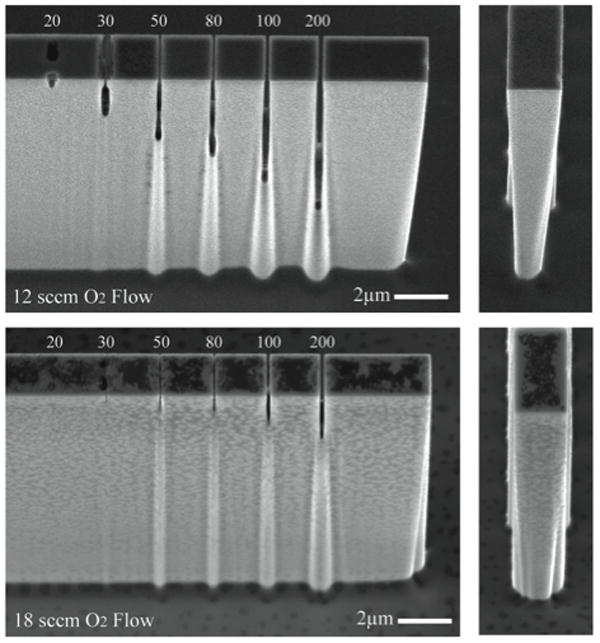
Membrane test structures with different sized pores (labeled in nm) were used to examine the effects of pore width and oxygen flow rates on pore depth. At 12 sccm of oxygen flow (top) no passivating material is visible and 200nm pores etch more than 60% of the membrane height. At higher oxygen flow rates (bottom), passivation is increased leaving passivating polymer deposited on structures and severe reductions in pore depth.