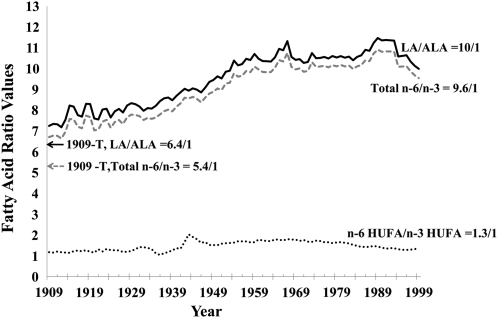
FIGURE 5.
Changes in ratios of n−6 to n−3 fatty acids in the US food supply from 1909 to 1999. Linoleic acid (LA)/α-linolenic acid (ALA) is indicated by a solid line, total n--6/total n--3 fatty acids by a dashed gray line, and n--6 highly unsaturated fatty acids (HUFA)/n--3 HUFAs by a dotted line. 1909-T (foods produced by traditional early 20th century practices) data are indicated by the solid arrow for the LA/ALA ratio and by a dashed gray arrow for the ratio of total n−6 to n−3. The LA:ALA ratio was lowest for 1909-T foods (6.4) and highest for 1999 foods (10.0). The ratio of total n−6 to n−3 was 5.4 in 1909-T and 9.6 in 1999.

