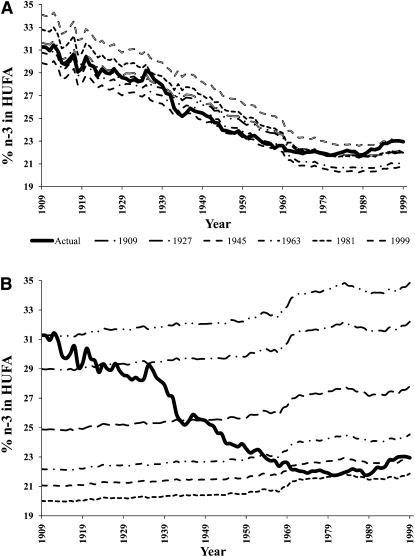
FIGURE 9.
Time-series determination of the dependence of the percentage of n−3 in highly unsaturated fatty acids (HUFA) on linoleic acid (LA) (A) compared with on α-linolenic acid (ALA) (B). Slopes of suggested regression lines between contrived series plots (dashed lines) and original functions (bold lines) were similar in direction and magnitude for LA. For ALA, slopes of regression lines were opposite in direction and lower in magnitude than the original prediction plot. Therefore, the tissue percentage of n−3 in HUFA was dependent on changes in dietary LA rather than in ALA.

