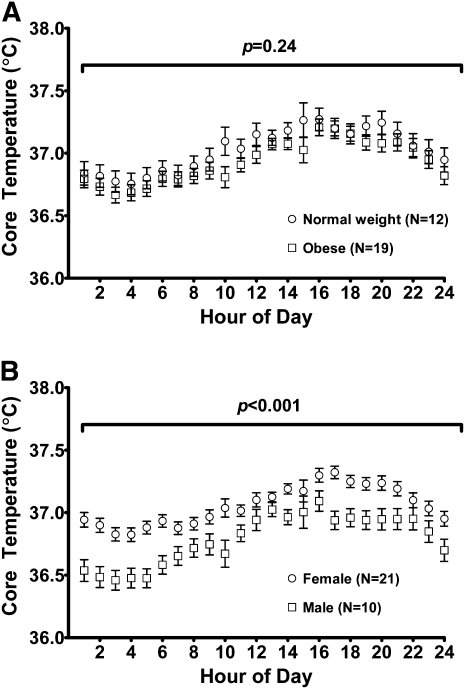
FIGURE 2.
Twenty-four-hour core temperature profiles. A: Normal-weight compared with obese subjects. Obesity status was not a significant predictor of core temperature. B: Male compared with female subjects. Women had, on average, a 0.27°C higher core temperature than that in men throughout the day. The analysis was conducted by using ANCOVA with repeated measures.

