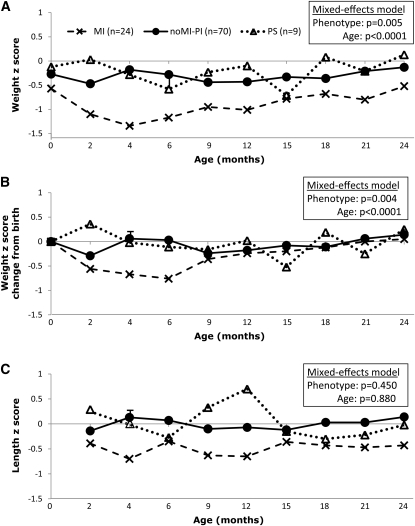
FIGURE 3.
Growth of cystic fibrosis infants by phenotype. A: Weight z scores. B: Weight gain from birth expressed by the change of weight z scores from birth. C: Length z scores. Mixed-effects models with repeated measures were performed to compare differences between phenotypes with adjustment for sex, birth weight z score, cystic fibrosis center, and age. The phenotype-by-age interaction was not significant (P > 0.50 for all panels); therefore, only main effects were included in the mixed-effects models. MI, meconium ileus; noMI-PI, no MI but pancreatic insufficient; PS, pancreatic sufficient.

