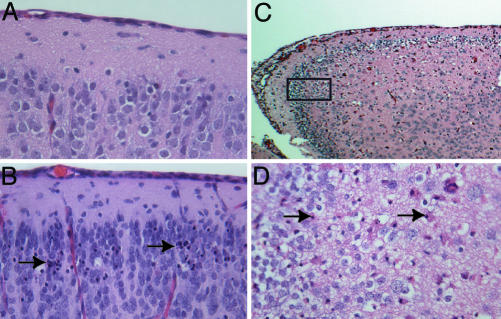
Fig. 5.
Neuropathology associated with EV1 infection in transgenic mice. (A-D) Hematoxylin/eosin-stained tissue sections. (A) Brain of nontransgenic mouse 4 days after infection (×40). (B) Brain of α2/β1 transgenic mouse 4 days after infection (×40). (C and D) Brain of α2 transgenic mouse 7 days after infection ×10 (C) and ×40 (D). Boxed area in C designates the area shown at higher magnification in D. Arrows in B and D indicate necrotic neurons.

