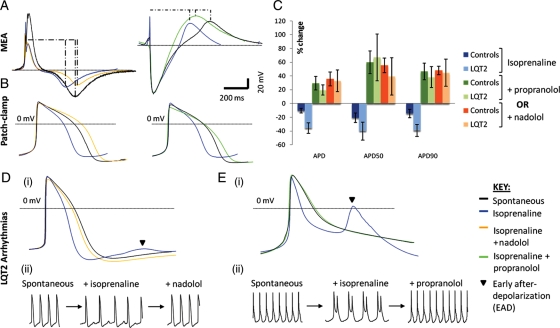
Figure 5.
Sensitivity of cardiomyocytes to β-adrenoreceptor agonists and antagonists. (A) Multi-electrode array and (B) patch-clamp analysis showing abbreviation of the field potential duration and action potential duration with isoprenaline treatment (blue traces) relative to the spontaneous beating curves (black traces), as well as prolongation of the field potential duration and action potential duration upon subsequent addition of the β-blockers, nadolol (orange traces) or propranolol (green traces). Curves are representative of both control and LQT2–hiPSC myocytes. (C) Graph showing increased sensitivity of LQT2–hiPSC myocytes to isoprenaline treatment relative to controls, and reversal of isoprenaline effects by β-blockers in patient and control cells. (D–E) (i) Averaged and (ii) raw action potential curves of LQT2–hiPSC myocytes showing isoprenaline-induced arrhythmogenesis (blue traces) and attenuation of this phenotype by nadolol (D, yellow trace) or propranolol (E, green trace).

