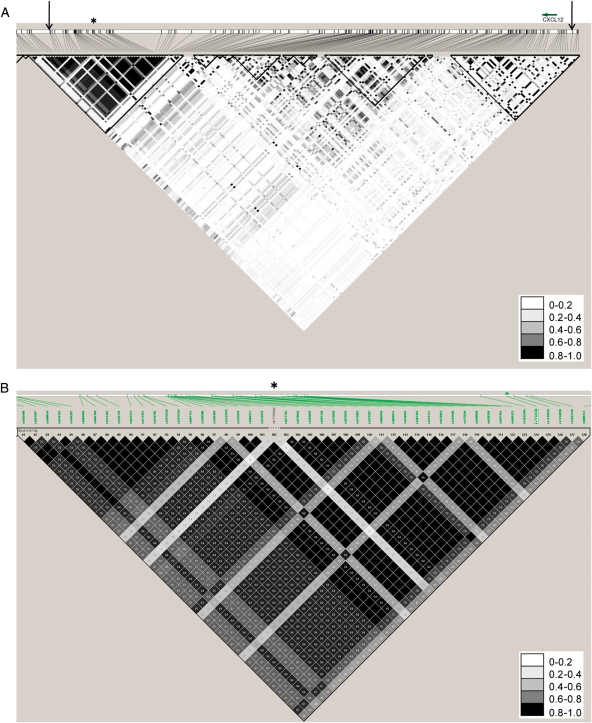
Figure 1.
The genomic region analysed surrounding the CXCL12 region. (A) Linkage disequilibrium in PennCath in the CXCL12 region, with arrows demarcating the region from around CXCL12 to the genome-wide association studies region. The asterisk denotes the haplotype block which contains rs1746048 and rs501120. (B) A magnified view of the haplotype block containing rs1746048 and rs501120 from the HapMap CEU population. The asterisk corresponds to the same position as the PennCath linkage disequilibrium plot, and the green arrowhead denotes rs1746048.

