Figure 3.
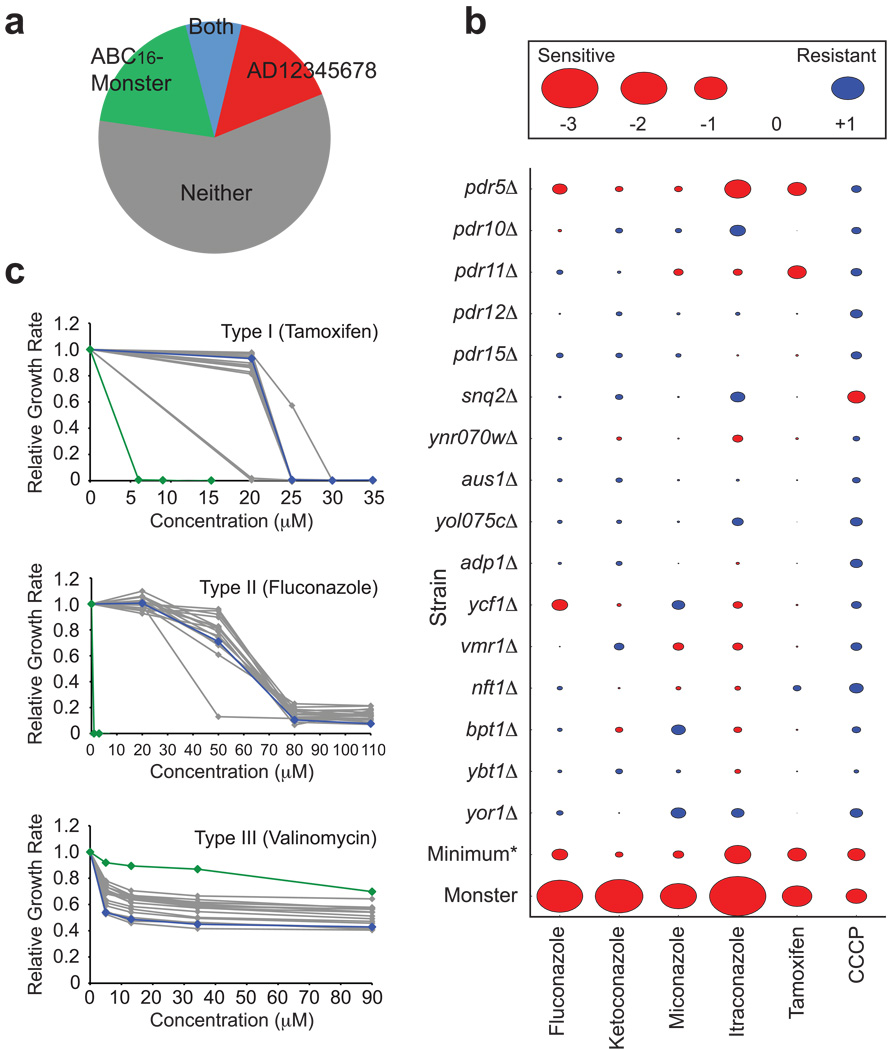
Hypersensitivity of the ABC16-monster to drugs. (a) Pie chart showing the number of drugs to which the ABC16-monster or the previously-described drug-hypersensitive AD strain is more sensitive. (b) A comparison of ABC16-monster and single-mutant drug sensitivity. The IC50 for each strain/drug combination relative to that of the corresponding non-mutant/drug combination was calculated. Area of each shape is proportional to this relative IC50 value. *: The minimum value among the relative IC50 values for single mutants is indicated for comparison with the relative IC50 of the ABC16-monster (c) Exponential growth rates of the ABC16-monster (green), non-mutant (blue), and single-deletion strains (grey) as a function of concentration of tamoxifen, fluconazole, and valinomycin.

