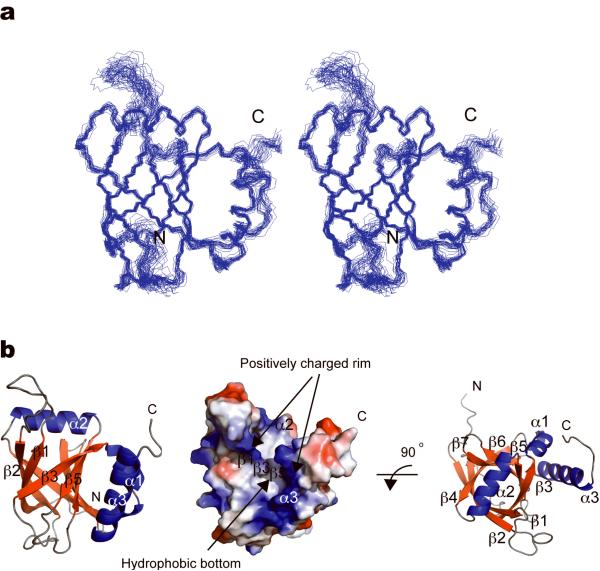
Figure 2.
Solution structure of the MED25 VBD determined by NMR. (a) The 25 lowest energy structures are shown overlaid using the secondary structure elements in side-by-side stereoview. The bundles are displayed 2.4 inches apart. (b) Cartoon drawing of MED25 VBD; the seven β-strands forming the barrel and the three ⟨-helices are depicted in red and blue respectively. The long α3 helix docks on the barrel by making close contact with β5, β6 and α1. Helix α2 caps the barrel from one side. A color-coded electrostatic surface potential shows a negative patch surrounded by areas of positive potential with a hydrophobic furrow in the center (b, middle panel), highlighted by arrows.

