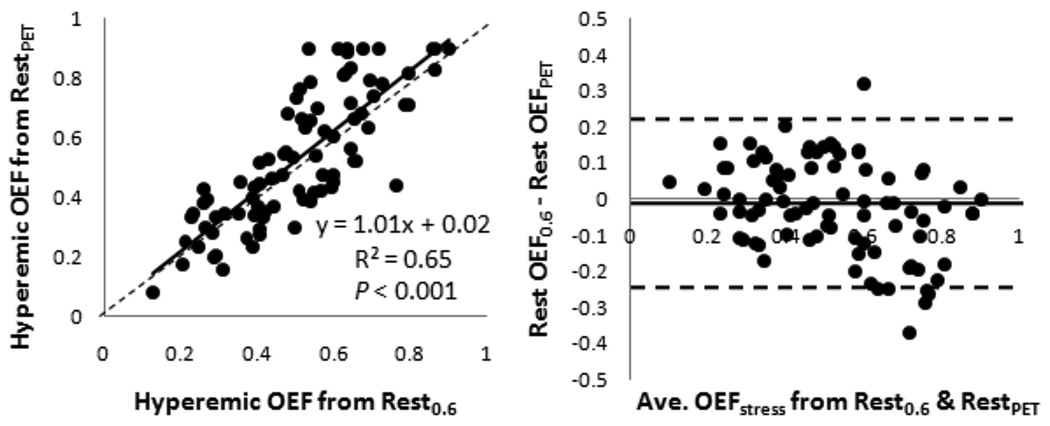
Figure 5.
Correlation between the MRI hyperemic OEF calculated with assumed rest OEF and rest OEF from PET. Left, regression analysis with solid line representing the linear fit and dotted line, the line of identity; Right, Bland-Altman analysis with distribution percentiles of differences (mean difference ± 1.96 SD). OEF, oxygen extraction fraction.

