Figure 1.
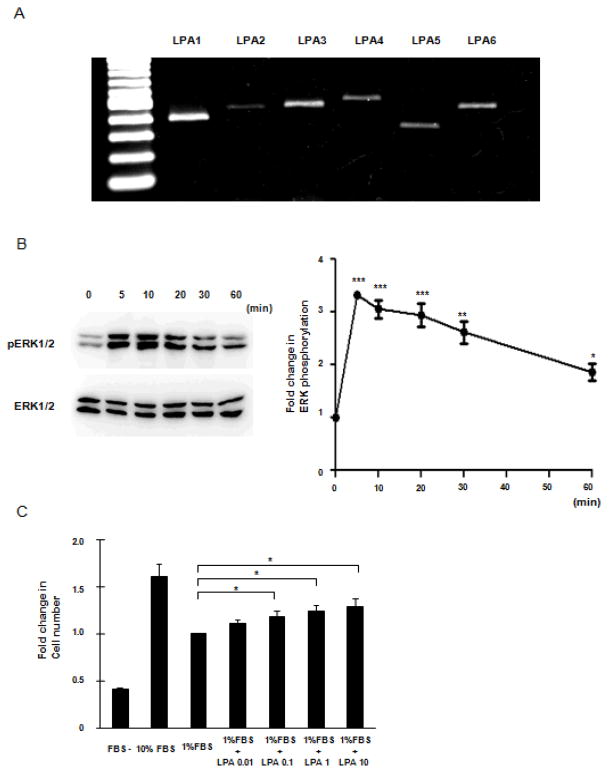
LPA receptor expression and responsiveness in CCL-151 cells. A: LPA receptor mRNA expression in CCL-151 cells assessed by PCR performed using primers to amplify either LPA1 (lane2), LPA2 (lane3), LPA3 (lane4), LPA4 (lane5), LPA5 (lane6) or LPA6 (lane7). Lane1 is a DNA ladder. B: Left side. Immunoblot showing phosphorylated ERK1/2 (p-ERK1/2) after stimulation with LPA; representative blots are shown from 3 independent experiments. Right side: Time course data are shown for 5, 10, 20, 30, 40, 50, and 60 minutes. Data were normalized by nonphosphorylated ERK and expressed relative to unstimulated controls. Results are expressed as mean ± SEM, n=3; ANOVA analysis showed significant differences between time course (P < 0.0001). Significant differences are indicated by ***P < 0.001, **P < 0.01 and * P < 0.05 compared with baseline. C: LPA induced proliferation of CCL-151 cells. Significant differences are indicated by *P < 0.05 compared with 1% FBS sample. Data are expressed as mean ± SEM of 3 independent experiments.

