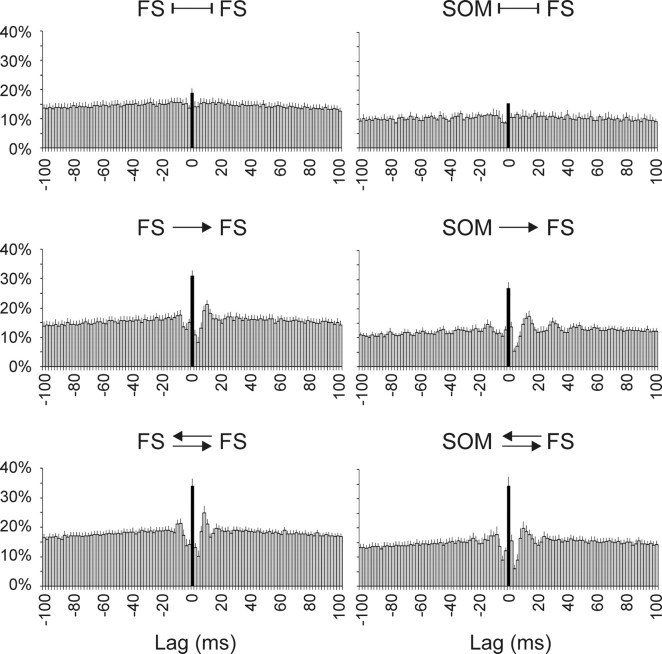
Figure 5.
Cross-correlation histograms reveal excess of submillisecond spike lags. Raw cross-correlograms of spike lags in FS–FS (left) and SOM–FS (right) pairs, averaged from all unconnected (top), unidirectionally connected (middle), and bidirectionally connected (bottom) pairs. In one-way connections, the presynaptic cell was used as the reference cell; the center right correlogram is an average of both SOM→FS and FS→SOM pairs. Bin width is 2 ms; the central bin (indicating lags of ±1 ms) is filled black. Error bars represent SEM.

