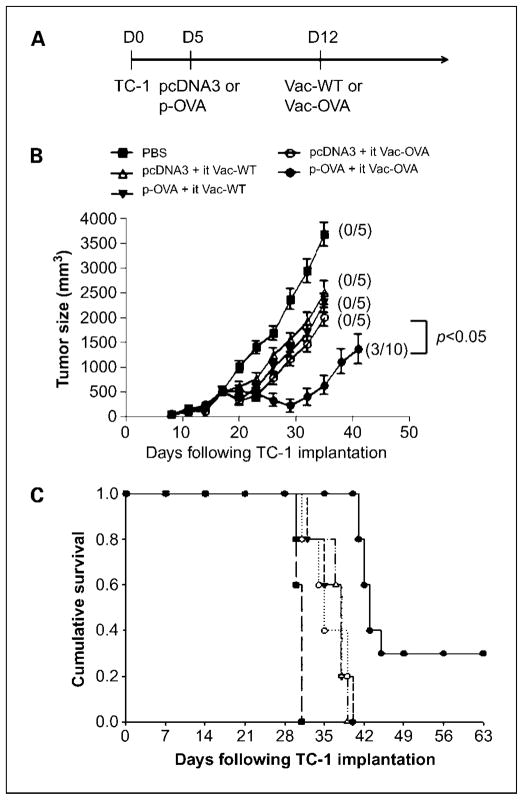
Fig. 2.
In vivo tumor treatment experiments withTC-1tumors. A, diagrammatic representation of the prime-boost treatment regimen. Groups of C57BL/6 mice (five per group) were s.c. challenged with 5 × 10⁴/mouse ofTC-1tumor cells. Five days after tumor challenge, mice were immunized with either 2 μg/mouse of pcDNA3 DNA or pcDNA3-expressing ovalbumin (p-OVA) by gene gun. On day12, mice were boosted by i.t. injection of 1 ×10⁷ pfu/mouse of either wild-type vaccinia (Vac-WT) or vaccinia encoding ovalbumin (Vac-OVA). TC-1tumor-bearing mice treated with 1×PBS were used as a control. B, line graph depicting the tumor volume inTC-1tumor-bearing mice treated with the different prime-boost regimens. Numbers in parentheses indicate complete tumor rejection rates. C, Kaplan-Meier survival analysis ofTC-1tumor-bearing mice treated with the different treatment regimens. Data shown are representative of two experiments. Points, mean; bars, SD.

