Fig. 3.
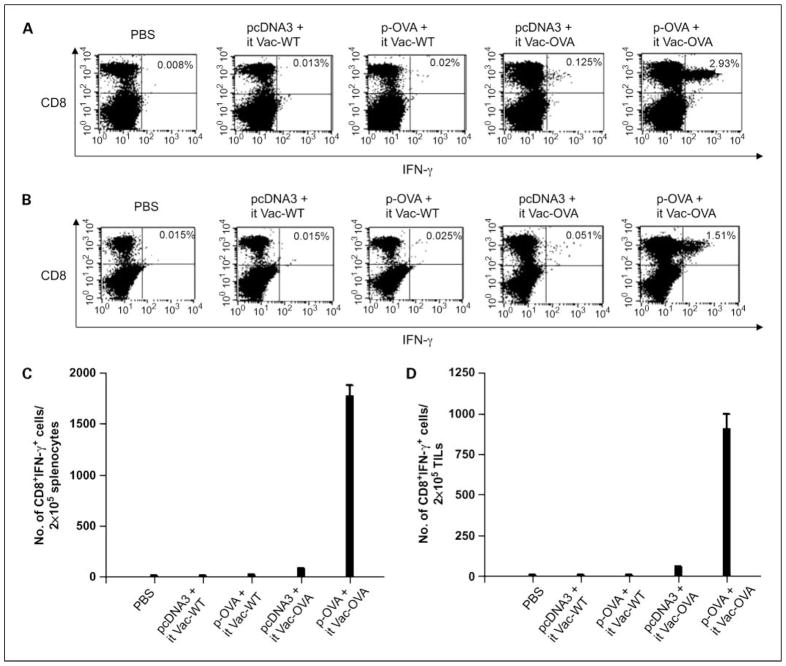
Intracellular cytokine staining followed by flow cytometry analysis to determine the number of OVA-specific CD8+ T cells in tumor-bearing mice treated with the different prime-boost regimens. Groups of C57BL/6 mice (five per group) were challenged s.c. with 5 × 10⁴ per mouse of B16/F10 tumor cells. Five days after tumor challenge, mice were immunized with either pcDNA3 or p-OVA DNA by gene gun and boosted by i.t. injection of either Vac-WT or Vac-OVA as shown in Fig. 1. TC-1 tumor-bearing mice treated with PBS were used as a control. Seven days after vaccinia infection, cells from the spleens (A and C) and tumors (B and D) of mice were harvested, incubated overnight with the OVA peptide, and stained for CD8 and intracellular IFN-γ and then characterized for OVA-specific CD8+ T cells using intracellular IFN-γ staining followed by flow cytometry analysis. Representative flow cytometry data showing the percentage of OVA-specific IFN-γ+ CD8+ T cells in the spleens (A) and tumors (B) of mice treated with the different prime boost regimens. Numbers of OVA-specific IFN-γ – secreting CD8+ T cells per 2 × 10⁵ pooled cells in the spleens (C) and tumors (D) of treated mice. Data shown are representative of two experiments. Columns, mean; bars, SD.

