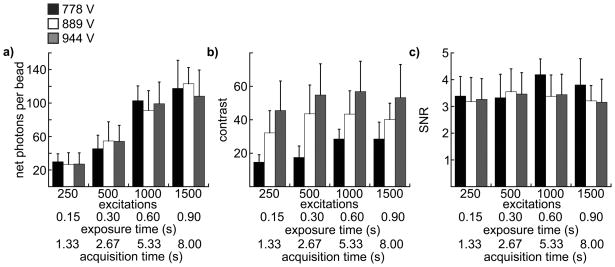
Figure 5.
Results of image analyses to determine photon acquisition efficiency, image contrast and instrument precision (SNR). Each chart presents data from 12 individual images collected at 4 different numbers of excitation/emission cycles, exposure times and total acquisition times (indicated on the x-axes) and 3 different intensifier gain voltages: 778 V (black columns), 889 V (white columns), 944 V (gray columns). Column height represents the mean value of each parameter (indicated on the y-axes) calculated from 29 single beads in a single image, and the error bars represent standard deviation. Source/detector timing parameters and frame summation (4 frames summed) were consistent for all images as described in Materials and Methods and Table 1. (a) The net number of photons acquired from a single bead. (b) Contrast. (c) SNR.

