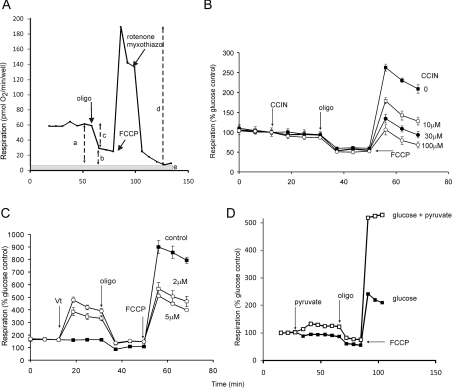
Figure 3. Cell respiratory control.
(A) Representative cell respiratory control experiment. Rat cortical neurones in the presence of glucose were exposed sequentially to oligomycin (oligo), FCCP and rotenone/myxothiazol. Non-mitochondrial respiration after the final addition (e) was subtracted from the other values. a, basal respiration; b, oligomycin-insensitive (leak) respiration; c, oligomycin-sensitive (ATP turnover) respiration; d, maximal respiration in the presence of FCCP. Derived parameters: coupling efficiency (c/a); respiratory control ratio (d/b); spare respiratory capacity (d−a). (B) Mouse cortical synaptosomes respiring on glucose in the presence of varying concentrations of the pyruvate transport inhibitor α-cyanocinnamate (CCIN). Note that inhibition is only seen when respiratory control is relieved by the protonophore, indicating an effect upstream of the proton circuit. (C) Synaptosomes respiring on glucose plus pyruvate; effect of the Na+ channel activator veratridine (Vt). Note the oligomycin-sensitive increase in basal respiration, indicating increased ATP utilization, and the unexpected decrease in maximal respiration. (D) Effect of supplementing glucose in the medium with pyruvate. Note that respiration is increased at all stages, showing that enhanced substrate supply exerts some control over basal and oligomycin-insensitive respiration (mediated by a slight mitochondrial hyperpolarization), although the major enhancement is seen in the presence of FCCP. Rates in (B–D) are expressed as a percentage of basal respiration in the presence of glucose. Adapted from [66].

