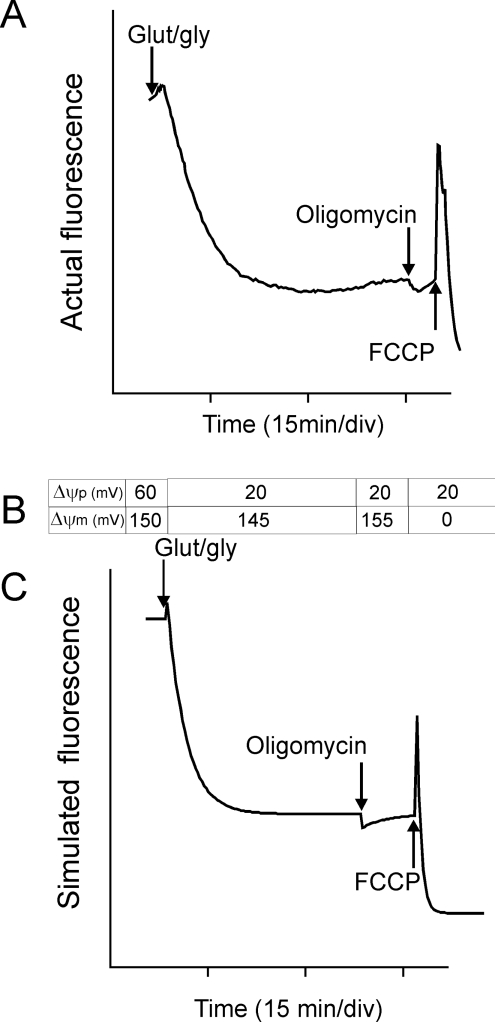
Figure 4. Mitochondrial membrane potential changes in situ.
(A) TMRM fluorescence (in quench mode) from a single cerebellar granule neuron exposed to glutamate plus glycine (Glut/gly) to activate NMDA (N-methyl-D-aspartate) receptors. Where indicated, oligomycin and FCCP were added. (B) Values for Δψp and Δψm input to a spreadsheet simulating Nernst equilibria across both membranes, differential equilibration times across plasma (slow) and mitochondrial (fast) membranes and matrix quenching at a critical concentration. (C) Simulated trace generated from (B). Note that the small initial increase indicates a slight (5 mV) mitochondrial depolarization; the plasma membrane depolarization resulting from receptor activation causes a slow decrease in fluorescence; the 10 mV hyperpolarization during the oligomycin ‘null-point test’ indicates that the mitochondria were still generating ATP, and the spike with FCCP confirms that the experiment was performed in quench mode. Adapted from [80]. min/div, min per time division shown.

