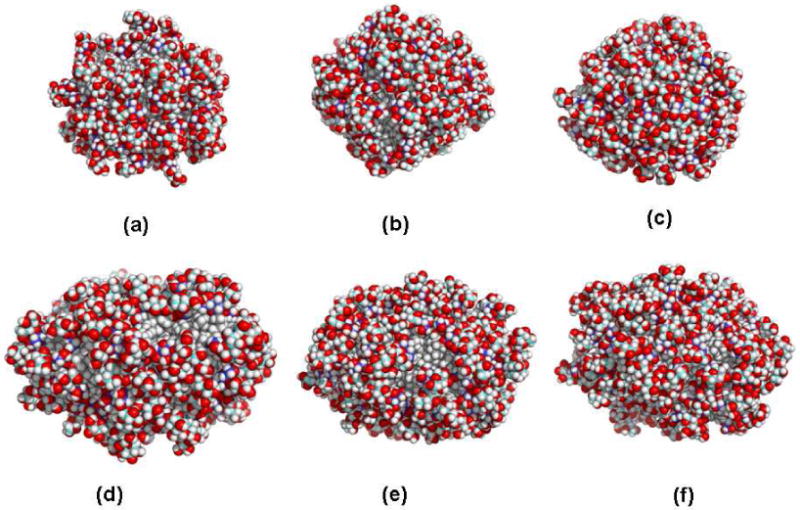
Figure 2.

Representative MD Snapshots of the α- (a-c) and β-anomers (d-f) of C12G2 micelles simulated with the CHARMM-Opt force field at t≈240 fs (a, d), t≈7.0 ns (b, e) and (c, f) and t ≈14 ns of the production period. Oxygen and hydrogen are in red, and white colors. Carbons in GlcA, GlcB and in the alkyl chain are blue, cyan and gray respectively. Water molecules are removed for visual clarity. Figures were produced with the PyMOL program.122
