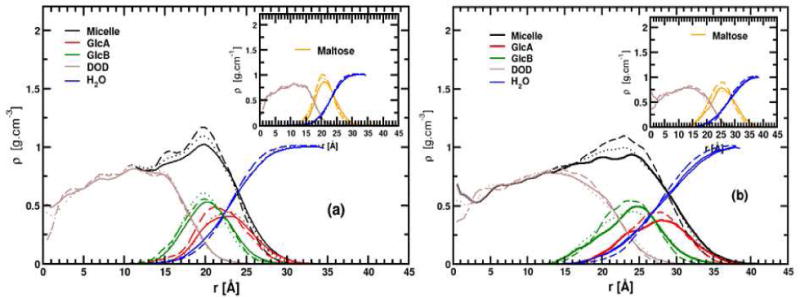
Figure 5.

Average radial density profiles with respect to the center of mass (r = 0 Å) for simulations performed with CHARMM-K (continuous line), CHARMM-Opt (dotted lines) and GLYCAM06 force fields (dashed line) for micelles α- (a) and β-anomers (b) of C12G2 micelles. In the inset, the radial profiles for the micelle hydrophobic core (maroon), the maltose headgroup (orange) and water (blue) are plotted. A 0.5 Å bin width was used for both figures.
