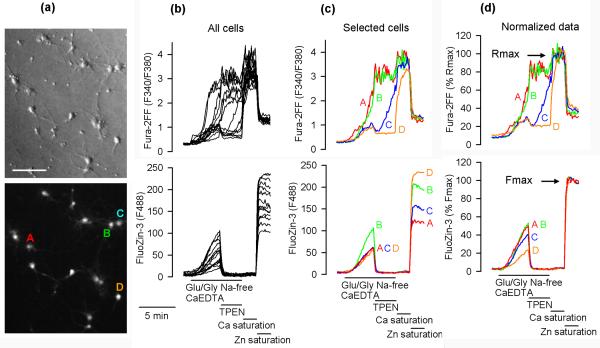
Figure 1.
Simultaneous monitoring of FluoZin-3 and Fura-2FF fluorescence in single hippocampal neurons. (a) Upper panel, Hoffman modulation contrast image of 14 hippocampal neurons cultured for 14 days. Bar = 100 μm. Lower panel, F488 fluorescence during Zn saturation in the same neurons. Indicated A, B, C, D are four exemplar neurons that are discussed in the text. (b) Fura-2FF F340/F380 ratio and Fluo-Zin-3 fluorescence (F488) data from all 14 neurons shown in (a). The neurons were exposed to 100 μM glutamate and 10 μM glycine (Glu/Gly) under Na+-free conditions with Na+ substituted with N-methyl-D-glucamine (NMDG+) and in the presence of 1 mM CaEDTA to chelate extracellular Zn2+. Where indicated, 10 μM TPEN was added to chelate intracellular Zn2+. At the end of the experiment, Fura-2FF was saturated with Ca2+ to measure the maximal F340/F380 ratio (Rmax) followed by saturation of FluoZin-3 with Zn2+ to measure the maximal F488 fluorescence (Fmax). (c) Fluorescence data from the four exemplar cells indicated in (a). (d) Normalized Fura-2 FF and FluoZin-3 data expressed as a percentage of Rmax and Fmax, respectively.

