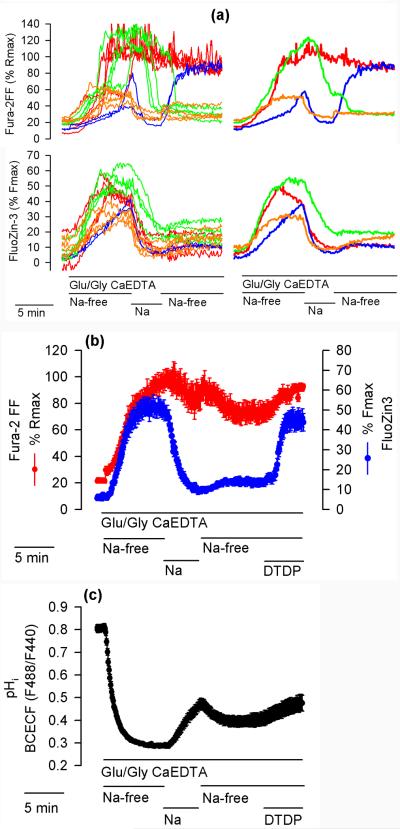
Figure 6.
Effects of Na+ and DTDP on FluoZin-3 and Fura-2FF fluorescence, and on pHi. (a) The neurons were exposed to Glu/Gly and 1 mM CaEDTA under Na+-free conditions (Na+ substituted with NMDG+). Where indicated, 158 mM Na+ (Na) was transiently applied while NMDG+ was removed. The patterns of Fura-2FF fluorescence change could be divided into four color-coded categories that are discussed in the text. The left panel shows Fura-2FF and FluoZin-3 fluorescence changes in individual neurons and the right panel shows average fluorescence changes in neurons representing each category. The experiment was repeated 7 times with similar results. (b) Experiment analogous to the one shown in (a) except that 100 μM DTDP was added during the second Na+-free period, where indicated. The data are means ± standard error from 16 neurons. The experiment was repeated 4 times with similar results. (c) Experiment analogous to the one shown in (b) except that pHi (BCECF F488/F440 ratio) was monitored. The data are means ± standard error from 23 neurons. The experiment was repeated 3 times with similar results.

