
Table 2.
Comparison of odds ratios across GWAS for selected SNPs
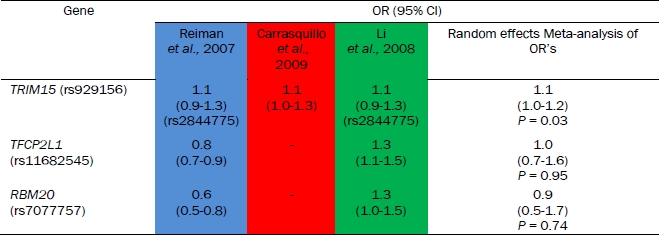 |
If the SNP was not present in a GWAS a perfect proxy (with r2 value of 1.0) was used to infer the odds ratio. The proxy SNP ID is shown underneath the corresponding odds ratios. The data shown is for the allelic association model. The 95% confidence interval for odds ratios are shown in brackets. The colours indicate the different GWAS (Reiman et al., 2007 – blue, Carrasquillo et al., 2009 – red and Li et al., 2008 – green). The results from random-effects meta-analysis of these odds ratios is given in the final column.