
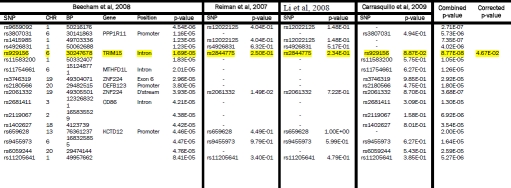
Supplementary Table 2.
Beecham et al, 2008 GWAS SNPs (5×10⁻⁵ < p < 5×10⁻⁸) compared with Reiman et al, 2007, Li et al, 2008 and Carrasquillo et al, 2009. The GWAS from which SNPs were initially selected is shown on the left. Each row represents a SNP with a p-value between 5×10⁻⁵ to 5×10⁻⁸. The p-values are highlighted yellow if p < 0.05 and they replicated across two or more studies. If a perfect proxy was used the corresponding rs number is listed. The combined p-values across studies are shown if the value approached genome-wide significance of 10−8. The final column shows the corrected p-value adjusted as described in the methods section. SNPs surviving correction for multiple testing are also highlighted in yellow.
 |