
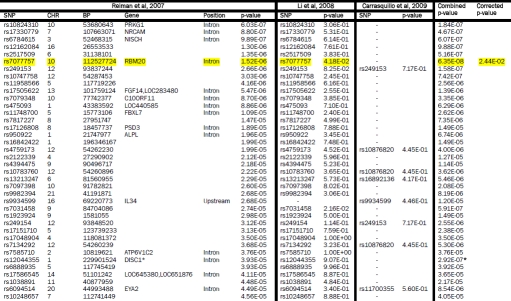
Supplementary Table 3.
Reiman et al, 2007 GWAS SNPs (5×10⁻⁵ < p < 5×10⁻⁸) compared with Li et al, 2008 and Carrasquillo et al, 2009. The GWAS from which SNPs were initially selected is shown on the left. Each row represents a SNP with a p-value between 5×10⁻⁵ to 5×10⁻⁸. The p-values are highlighted yellow if p < 0.05 and they replicated across two or more studies. If a perfect proxy was used the corresponding rs number is listed. The combined p-values across studies are shown if the value approached genome-wide significance of 10−8. The final column shows the corrected p-value adjusted as described in the methods section. SNPs surviving correction for multiple testing are also highlighted in yellow. DISC1 is starred to indicate that the combined p-value listed has included the data (p=8.20E-03) from the Beecham et al, 2008 study.
 |