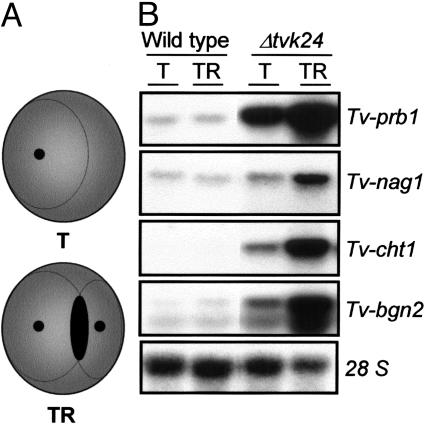
Fig. 4.
Expression of MRGs in direct confrontation with R. solani. (A) Schematic representation of the interaction between T. virens strains and R. solani. T, T. virens strain growing alone in VMS plates; TR, T. virens strain growing in presence of R. solani. The interaction zone is colored black. (B) Expression of MRGs in T. virens strains. Samples were collected when T. virens strains grew 1.0 cm over the colony of R. solani. The probes used for the Northern blot analysis were the same as those indicated in Fig. 3. Fifteen micrograms total RNA were loaded in each lane.

