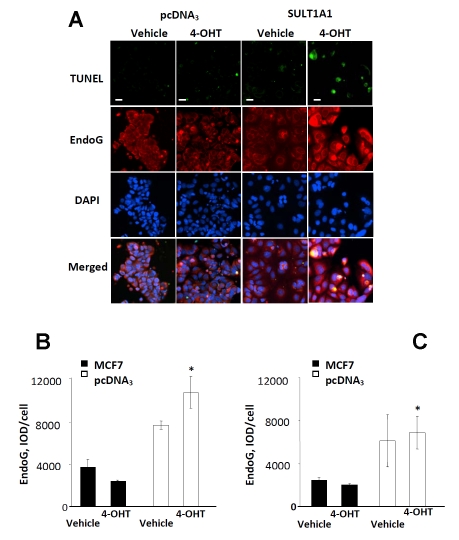
Figure 5.
EndoG expression increases in 4-OHT treated SULT1A1 expressing cells, representative images (A). EndoG protein expression in apoptotic subpopulation (B) and entire population (C) of pcDNA3- and SULT1A1-expressing MCF7 cells treated with vehicle or 4-OHT for 24 hours. Immunocytochemistry and TUNEL assay were performed as described in Materials and Methods. n=8, #p<0.05 compared to pcDNA3 expressing cells. n=8, scale bar – 30 µm.

