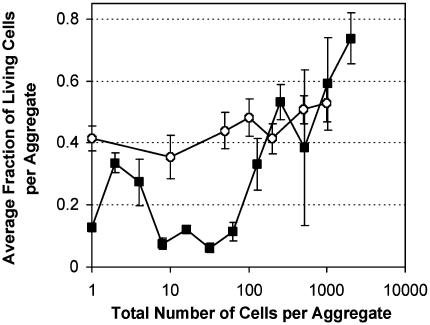
Fig. 4.
Fraction of living cells in relation to the total number of cells in the aggregate in which they occurred for cell aggregates artificially generated from cultured cells on slides (circles) or for aggregates recovered from plants and deposited onto membranes filters (squares). Slides and filters were exposed to low RH for 8 h after cell deposition. Vertical bars represent the standard error of the mean fraction of living cells in aggregates of different sizes.

